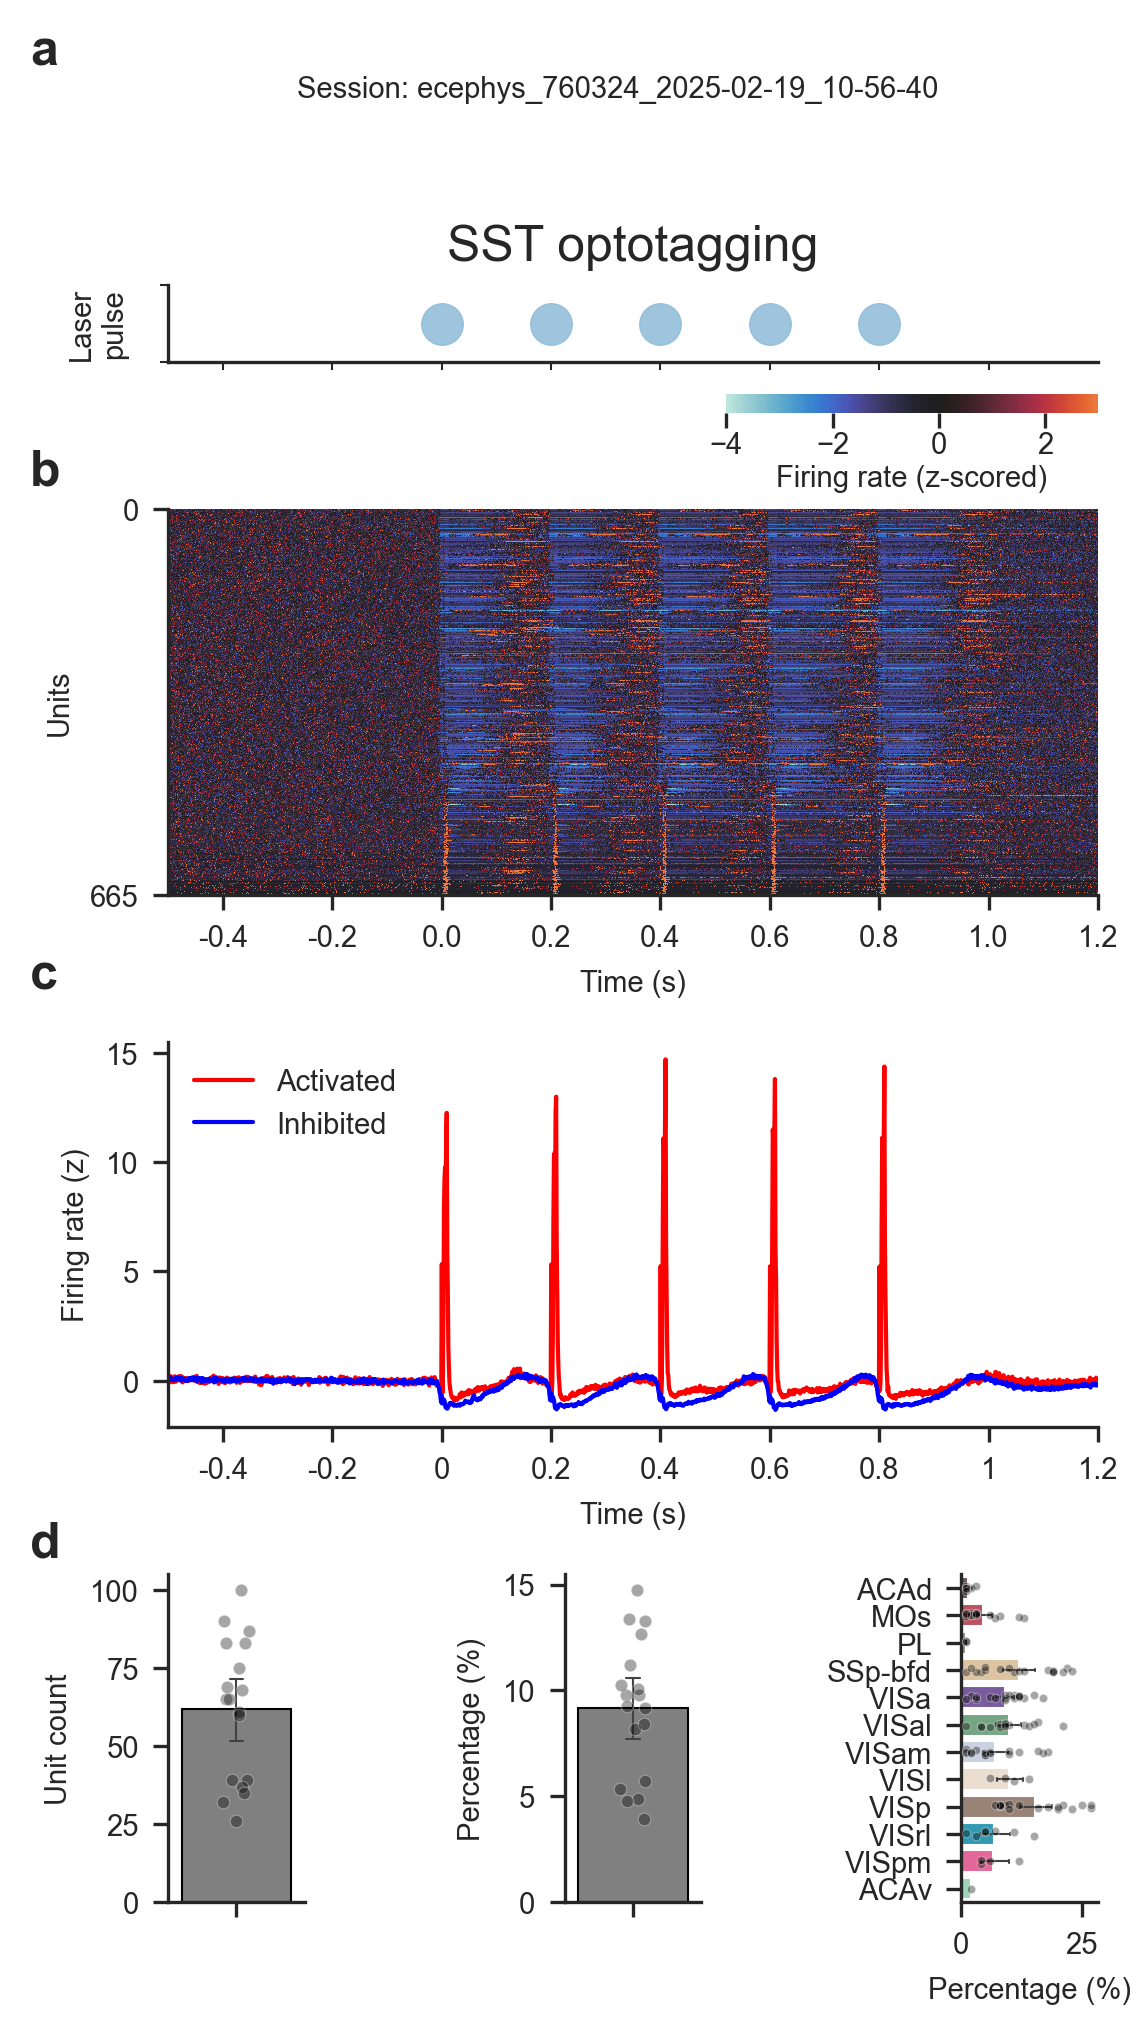
Figure S1:Optotagging identifies SST interneurons
(a) 5 Hz laser pulse used for the optotagging protocol aligned to (b) and (c).
(b) Single-unit firing rates of an example session (ecephys-760324-2025-02-19-10-56-40). Shown here are all neurons with significant modulation following laser stimulation.
(c) Average firing rate of activated and inhibited neurons in the same session as (b).
(d) Average count (left) and percentage (center) of optotagged cortical neurons per session. Right: average percentage of optotagged neurons per cortical area.
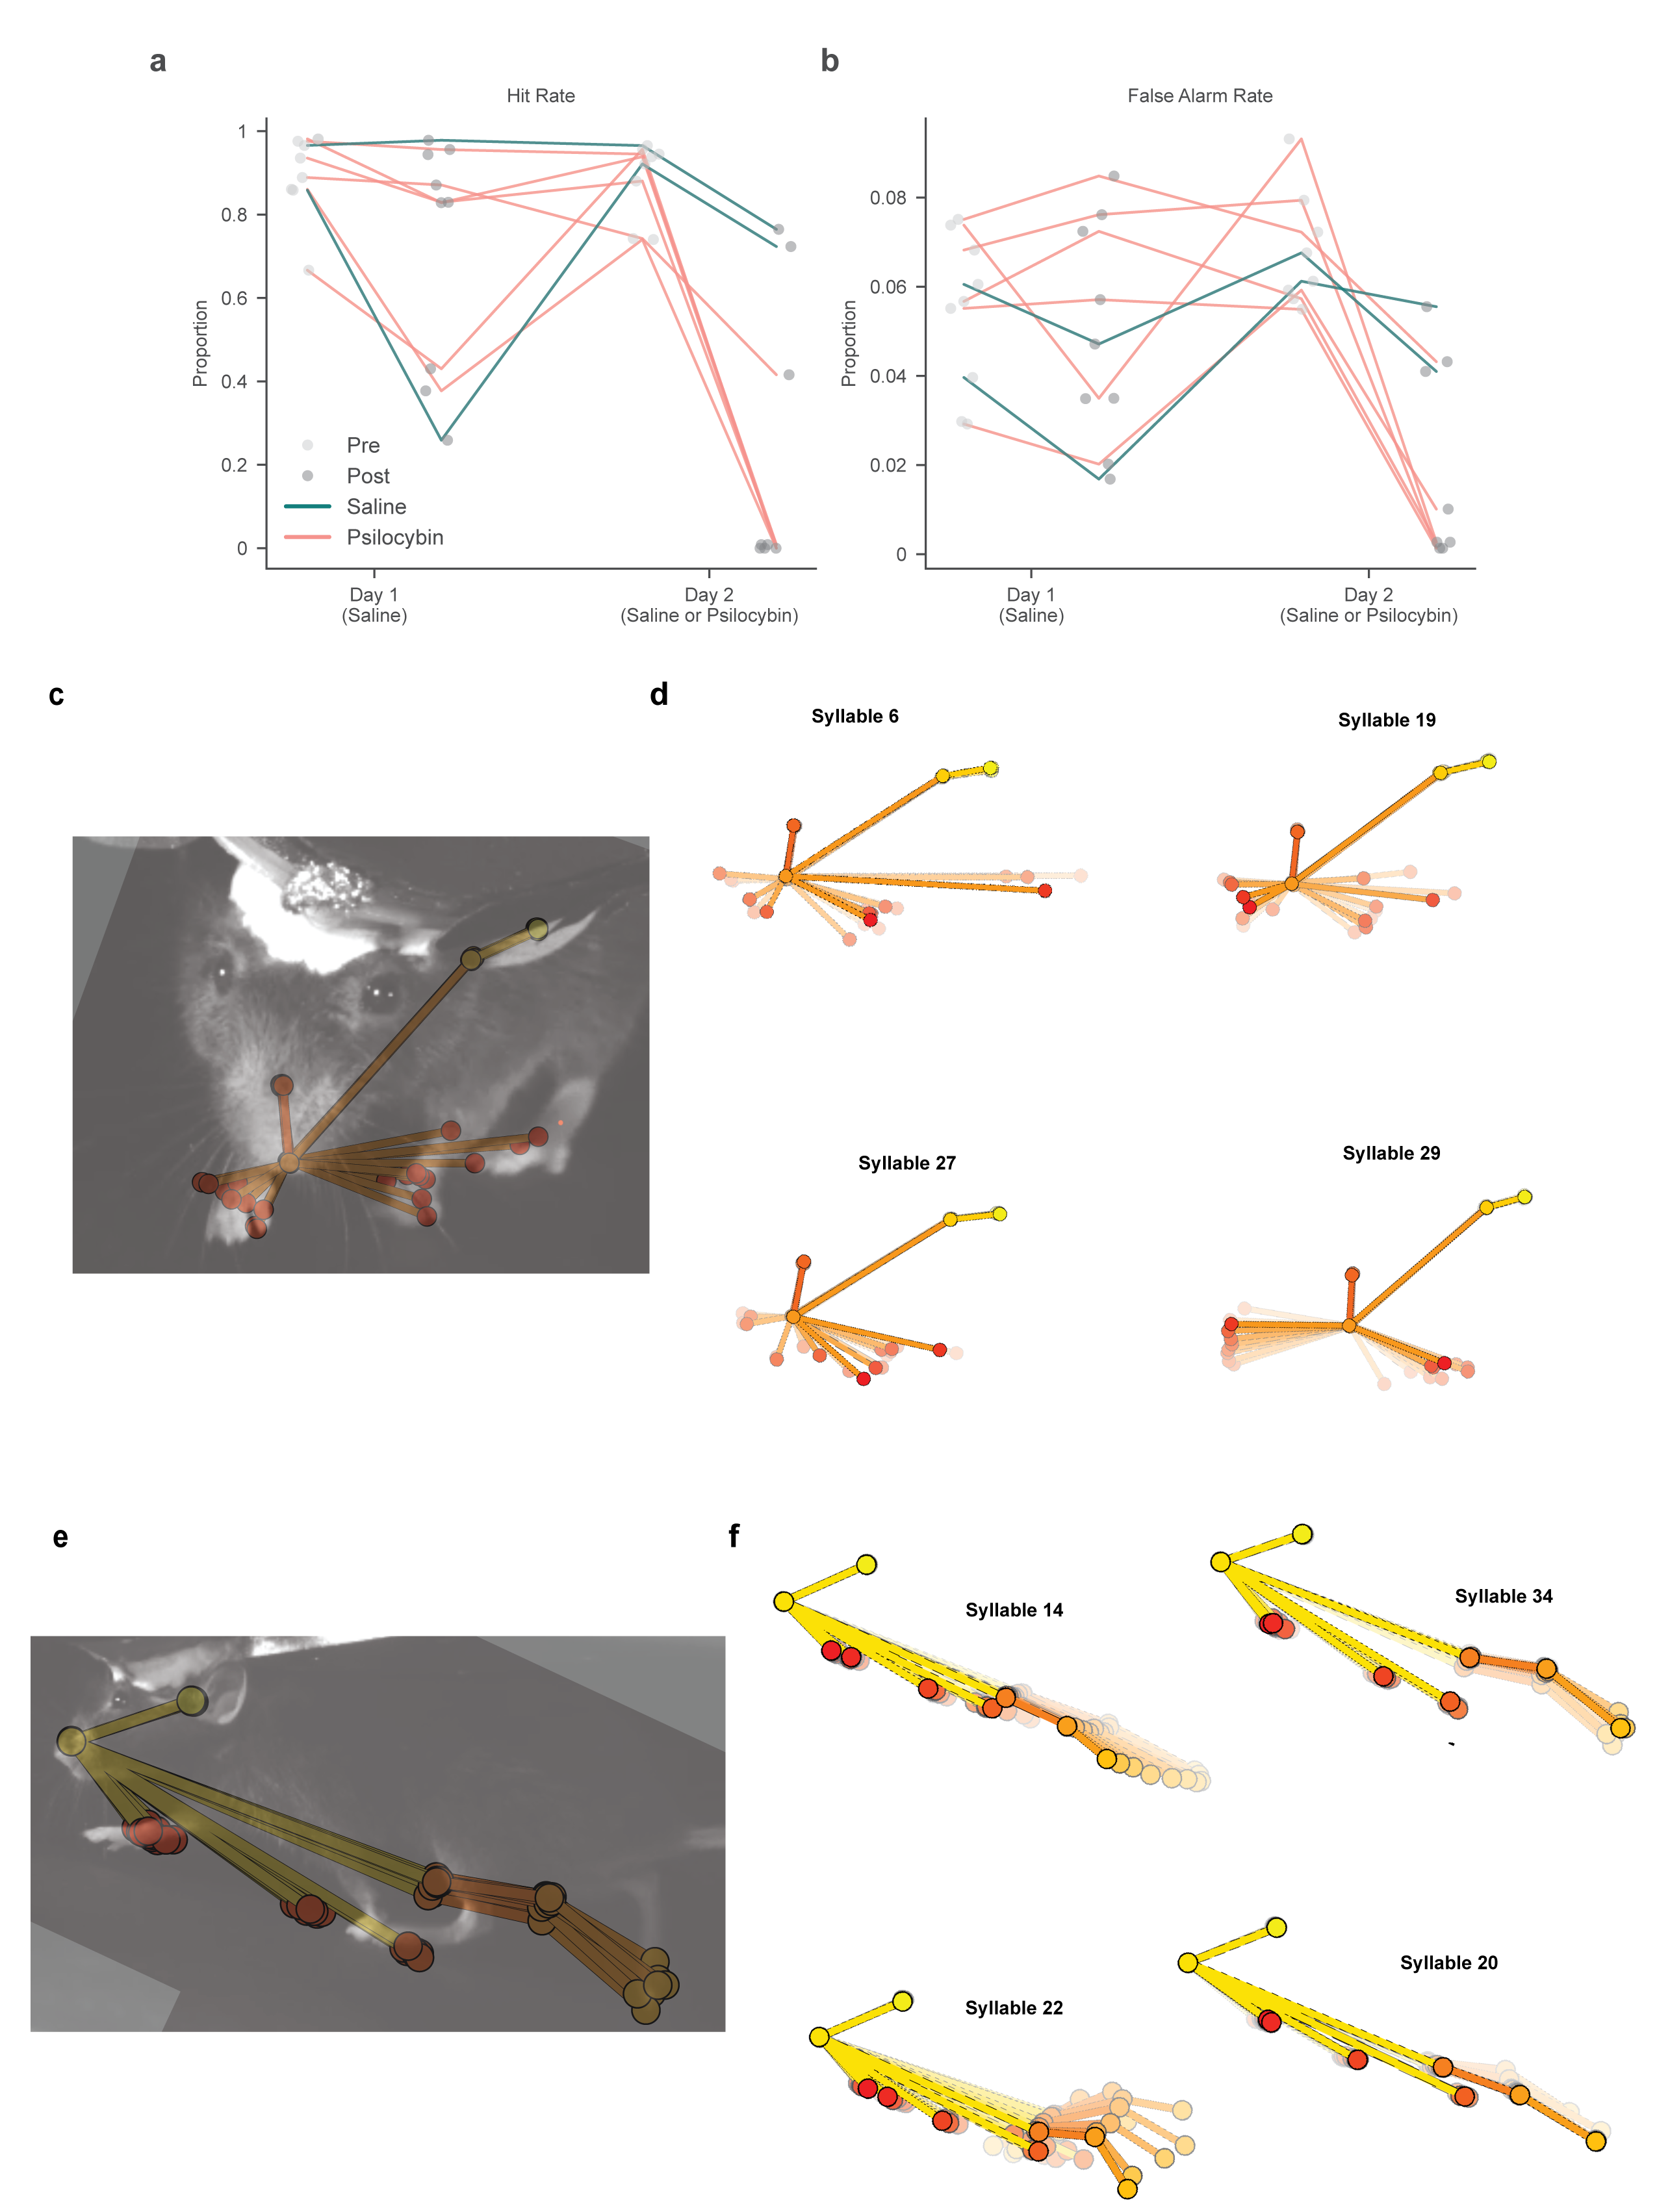
Figure S2:Behavioral performance and MoSeq analysis
(a) Hit rate measured before (Pre, light gray circles) and after (Post, dark gray circles) injection across Day 1 and Day 2. Each circle represents a single behavioral session. Lines connect the performance trajectories of individual animals across experimental epochs and days. Teal lines track control animals that received saline injections on both days (n = 2).
(b) False alarm rate across experimental epochs and days, formatted identically to (a).
(c) Frontal camera view with superimposed keypoints extracted with DeepLabCut.
(d) Example syllables extracted from frontal camera videos. Each trajectory plot shows a sequence of poses along the average trajectory through latent space associated with a given syllable.
(e) Same as (c) for lateral camera videos.
(f) Same as (d) for lateral camera videos.
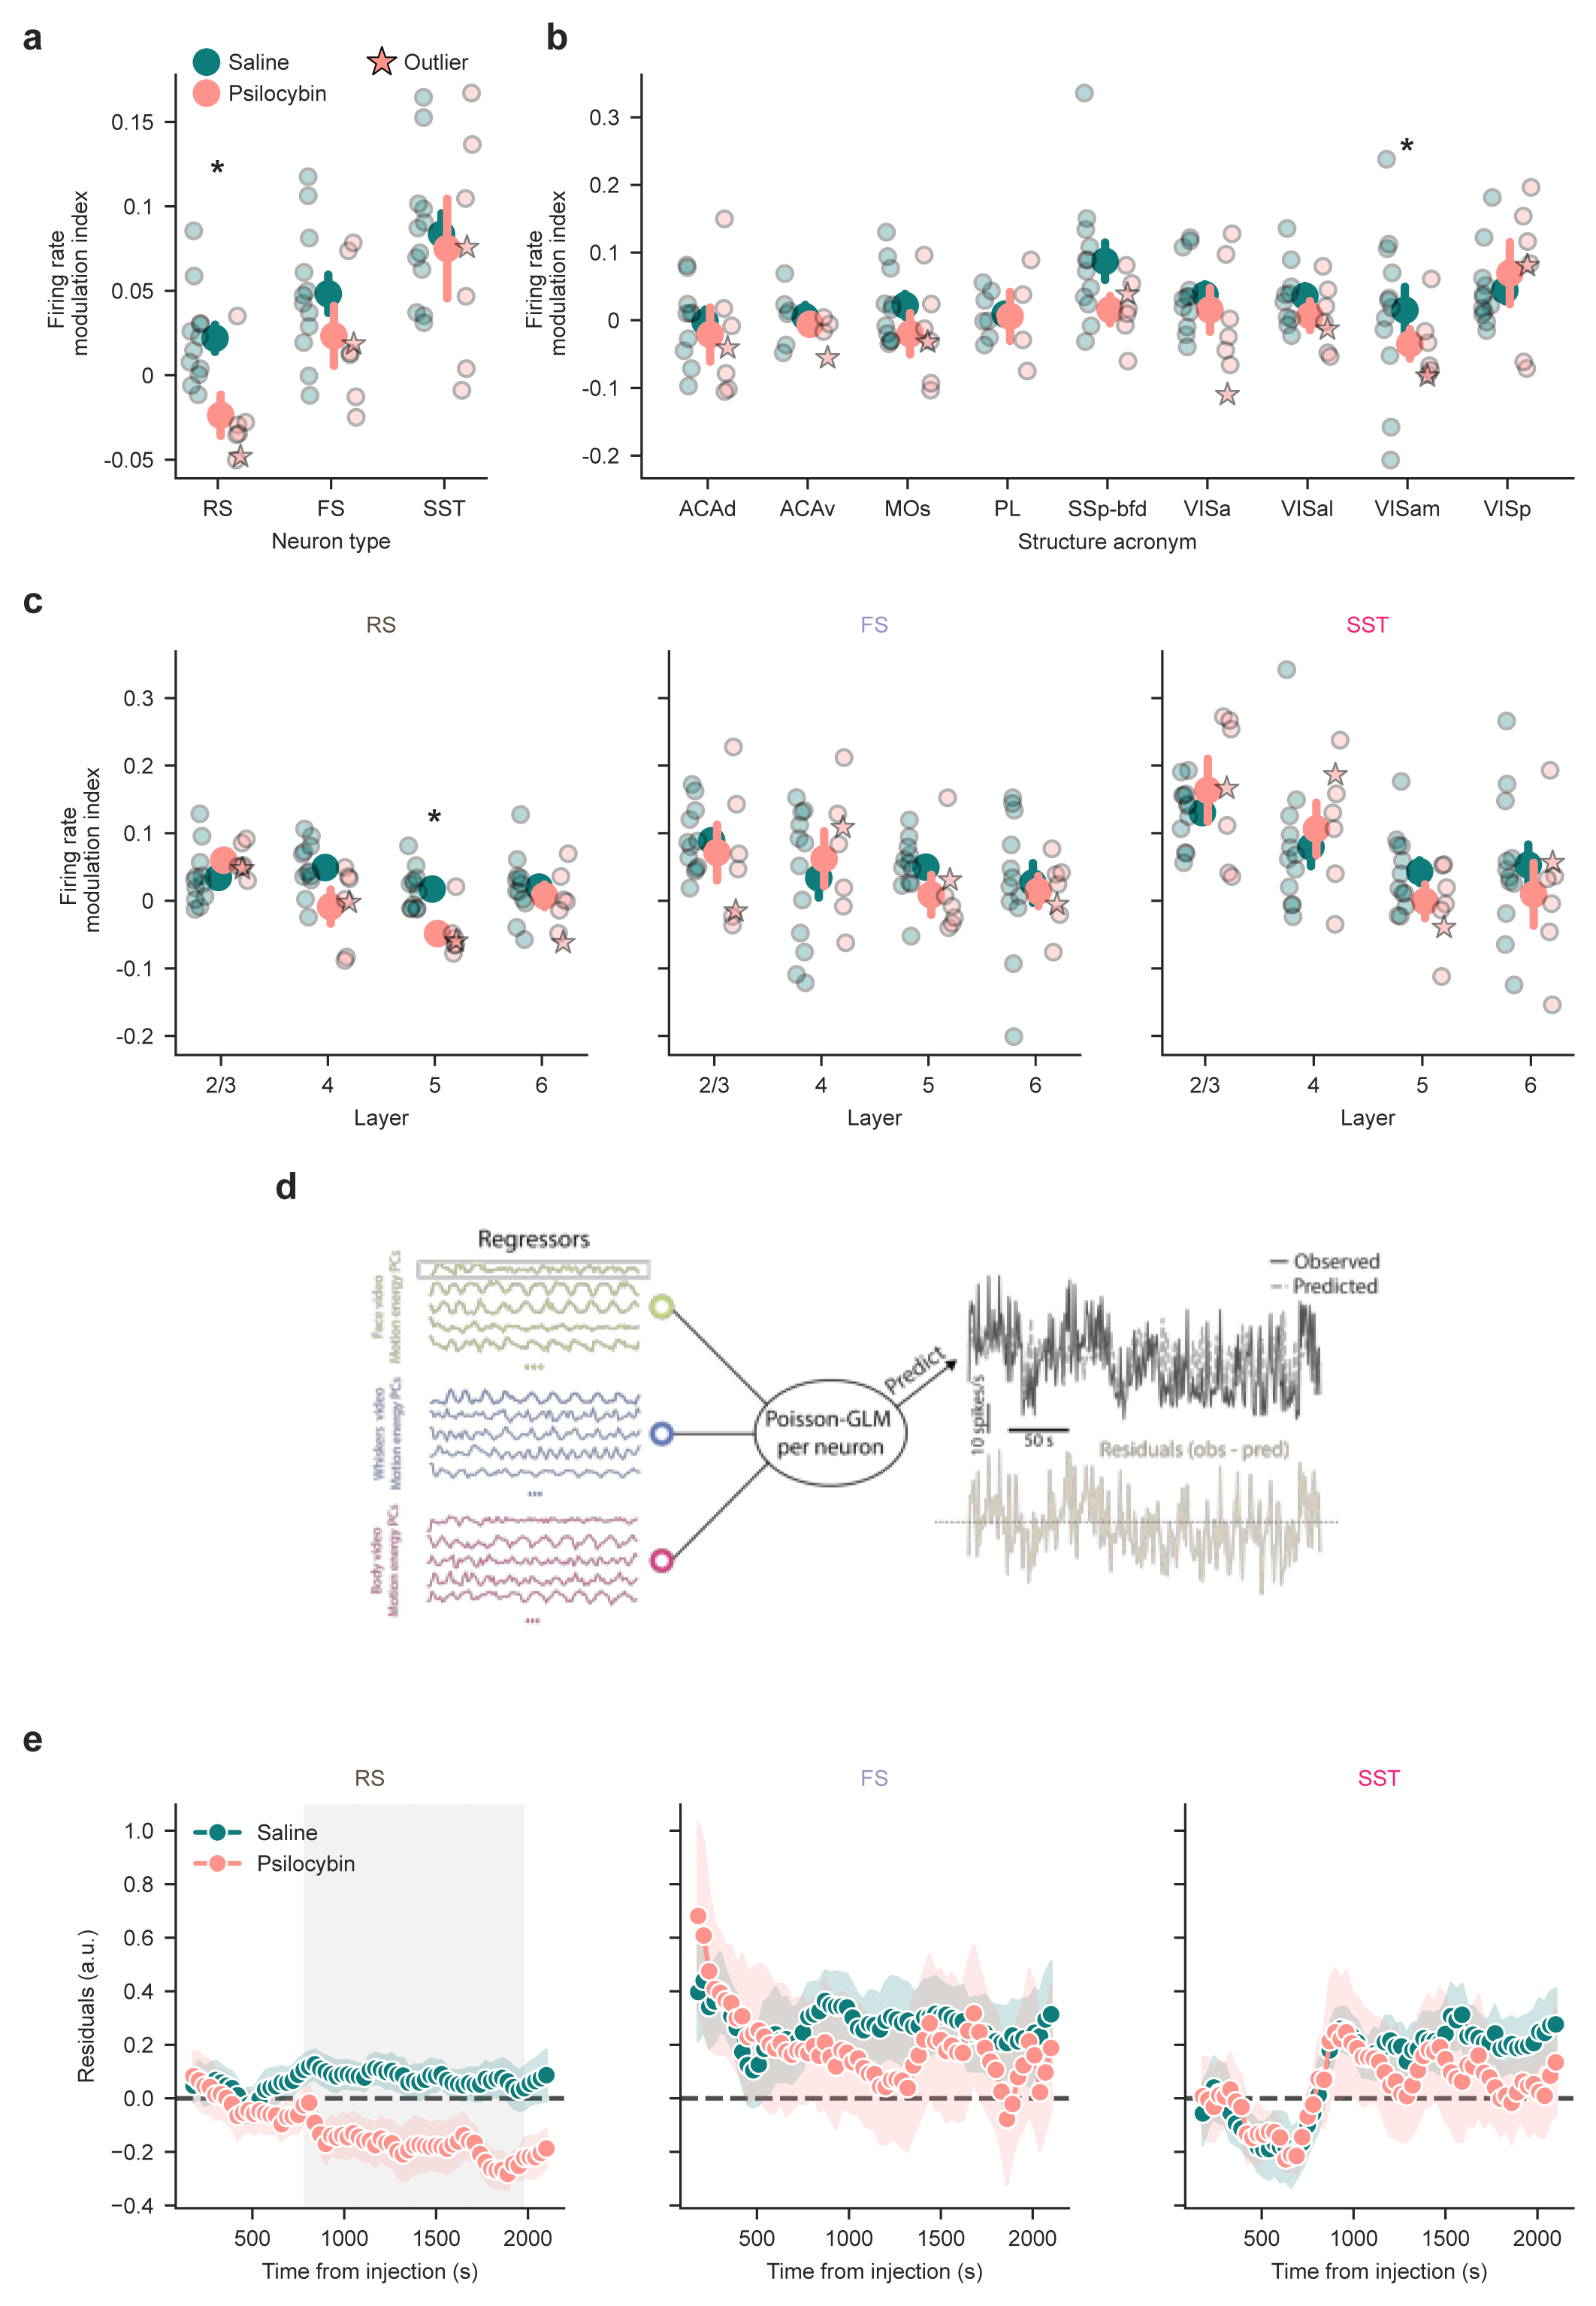
Figure S3:Psilocybin decreases activity in cortical RS neurons
(a) Firing rate modulation index across neuron types. Psilocybin causes a significant decrease of firing rates in RS neurons (psilocybin = -0.024 ± 0.012, saline = 0.022 ± 0.008, mean ± s.e.m. across sessions, p = 0.048, hierarchical bootstrap).
(b) Firing rate modulation index across brain areas, with no significant differences.
(c) Firing rate modulation index across layers and neuron types. Psilocybin causes a significant decrease of firing rates in layer 5 RS neurons (psilocybin = -0.048 ± 0.014, saline = 0.017 ± 0.008, mean ± s.e.m. across sessions, p = 0.019, hierarchical bootstrap).
(d) Schematic of the GLM-based prediction. We extracted 40 principal components (PCs) from three behavioral videos using FaceMap. These PCs were used as regressors in a Poisson GLM fitted to each neuron’s activity during the pre-injection block. The model was then used to predict firing rates in the post-injection block. Residuals were computed as (observed − predicted) / √(predicted), yielding standardized residuals.
(e) Grand average time course of residuals per group (psilocybin vs. saline). Residuals were first aggregated within each session using a median estimator (see Methods). RS neurons exhibit a significant decrease in firing rate beginning ~30 min post-injection. Gray rectangle represents p < 0.05 using Mann-Whitney-U test. Shading indicates ±1 s.e.m. Error bars in all panels represent ±1 s.e.m.
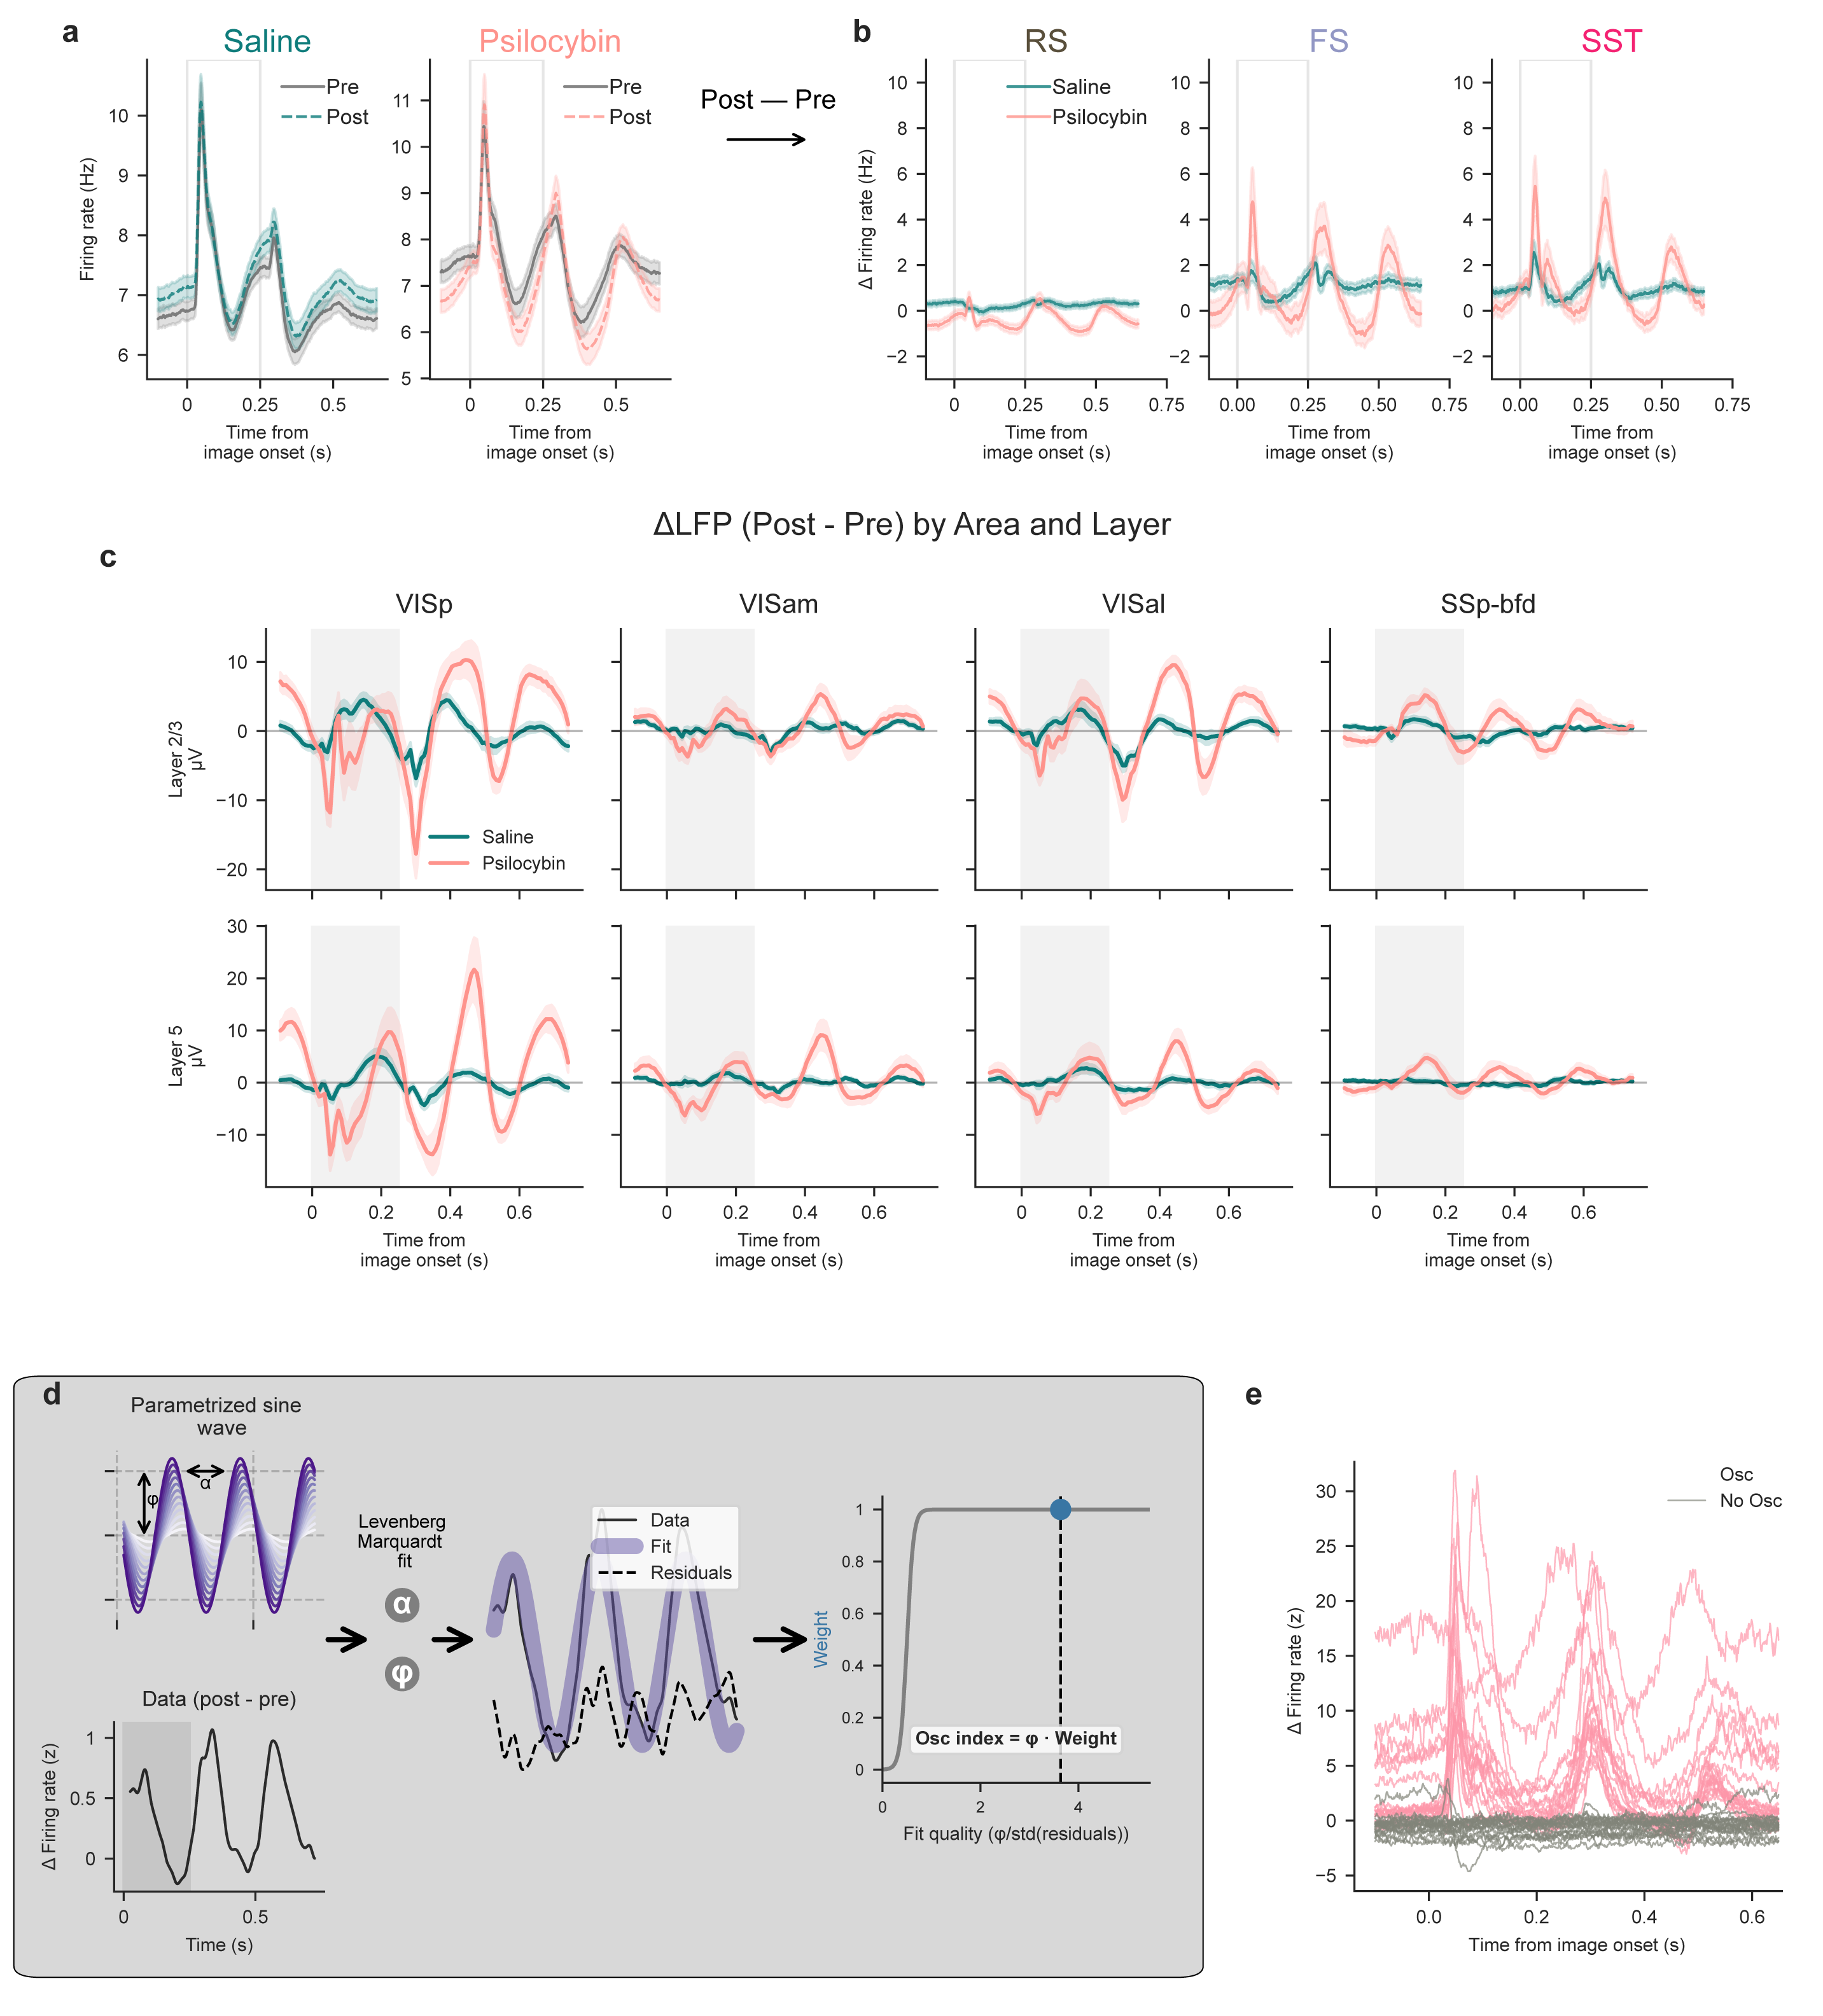
Figure S4:Psilocybin induces a a 4-Hz oscillation in visual cortex across scales
(a) Average PSTH of all cortical neurons aligned to all non-change images pre and post injection. Psilocybin causes a rhythmic change in firing rate. Shading indicates ± 1 s.e.m.
(b) ΔPSTH (post − pre epochs) of all cortical neurons recorded separately for each cell type. A clear modulation is visible across cell types, prominently in FS and SST neurons. Shading indicates ± 1 s.e.m.
(c) Layer 2/3 (top row) and layer 5 (bottom row) delta LFPs of VISp, VISam, VISal and SSp-bfd. Each delta LFP is computed by subtracting the image onset-aligned (only non-change)traces of the pre-injection block from the post-injection block. The psilocybin group shows a clear modulation similar to the one shown in the spike analysis. Shading indicates ± 1 s.e.m.
(d) Analytical framework for calculating the oscillation index. A 4-Hz sine wave was fitted to the delta PSTH (post-injection minus pre-injection epochs) of each individual neuron by optimizing both amplitude and phase. The resulting residuals were used to calculate a fit-quality metric, defined as the ratio of the fitted amplitude to the standard deviation of the residuals. To ensure the index selectively reflects robust rhythmic activity, the final oscillation index was down-weighted in cases of low fit quality (see Methods).
(e) Example neurons from session ecephys_752311_2025-01-23_14-00-04. Osc index can reliably identify strongly oscillating neurons.
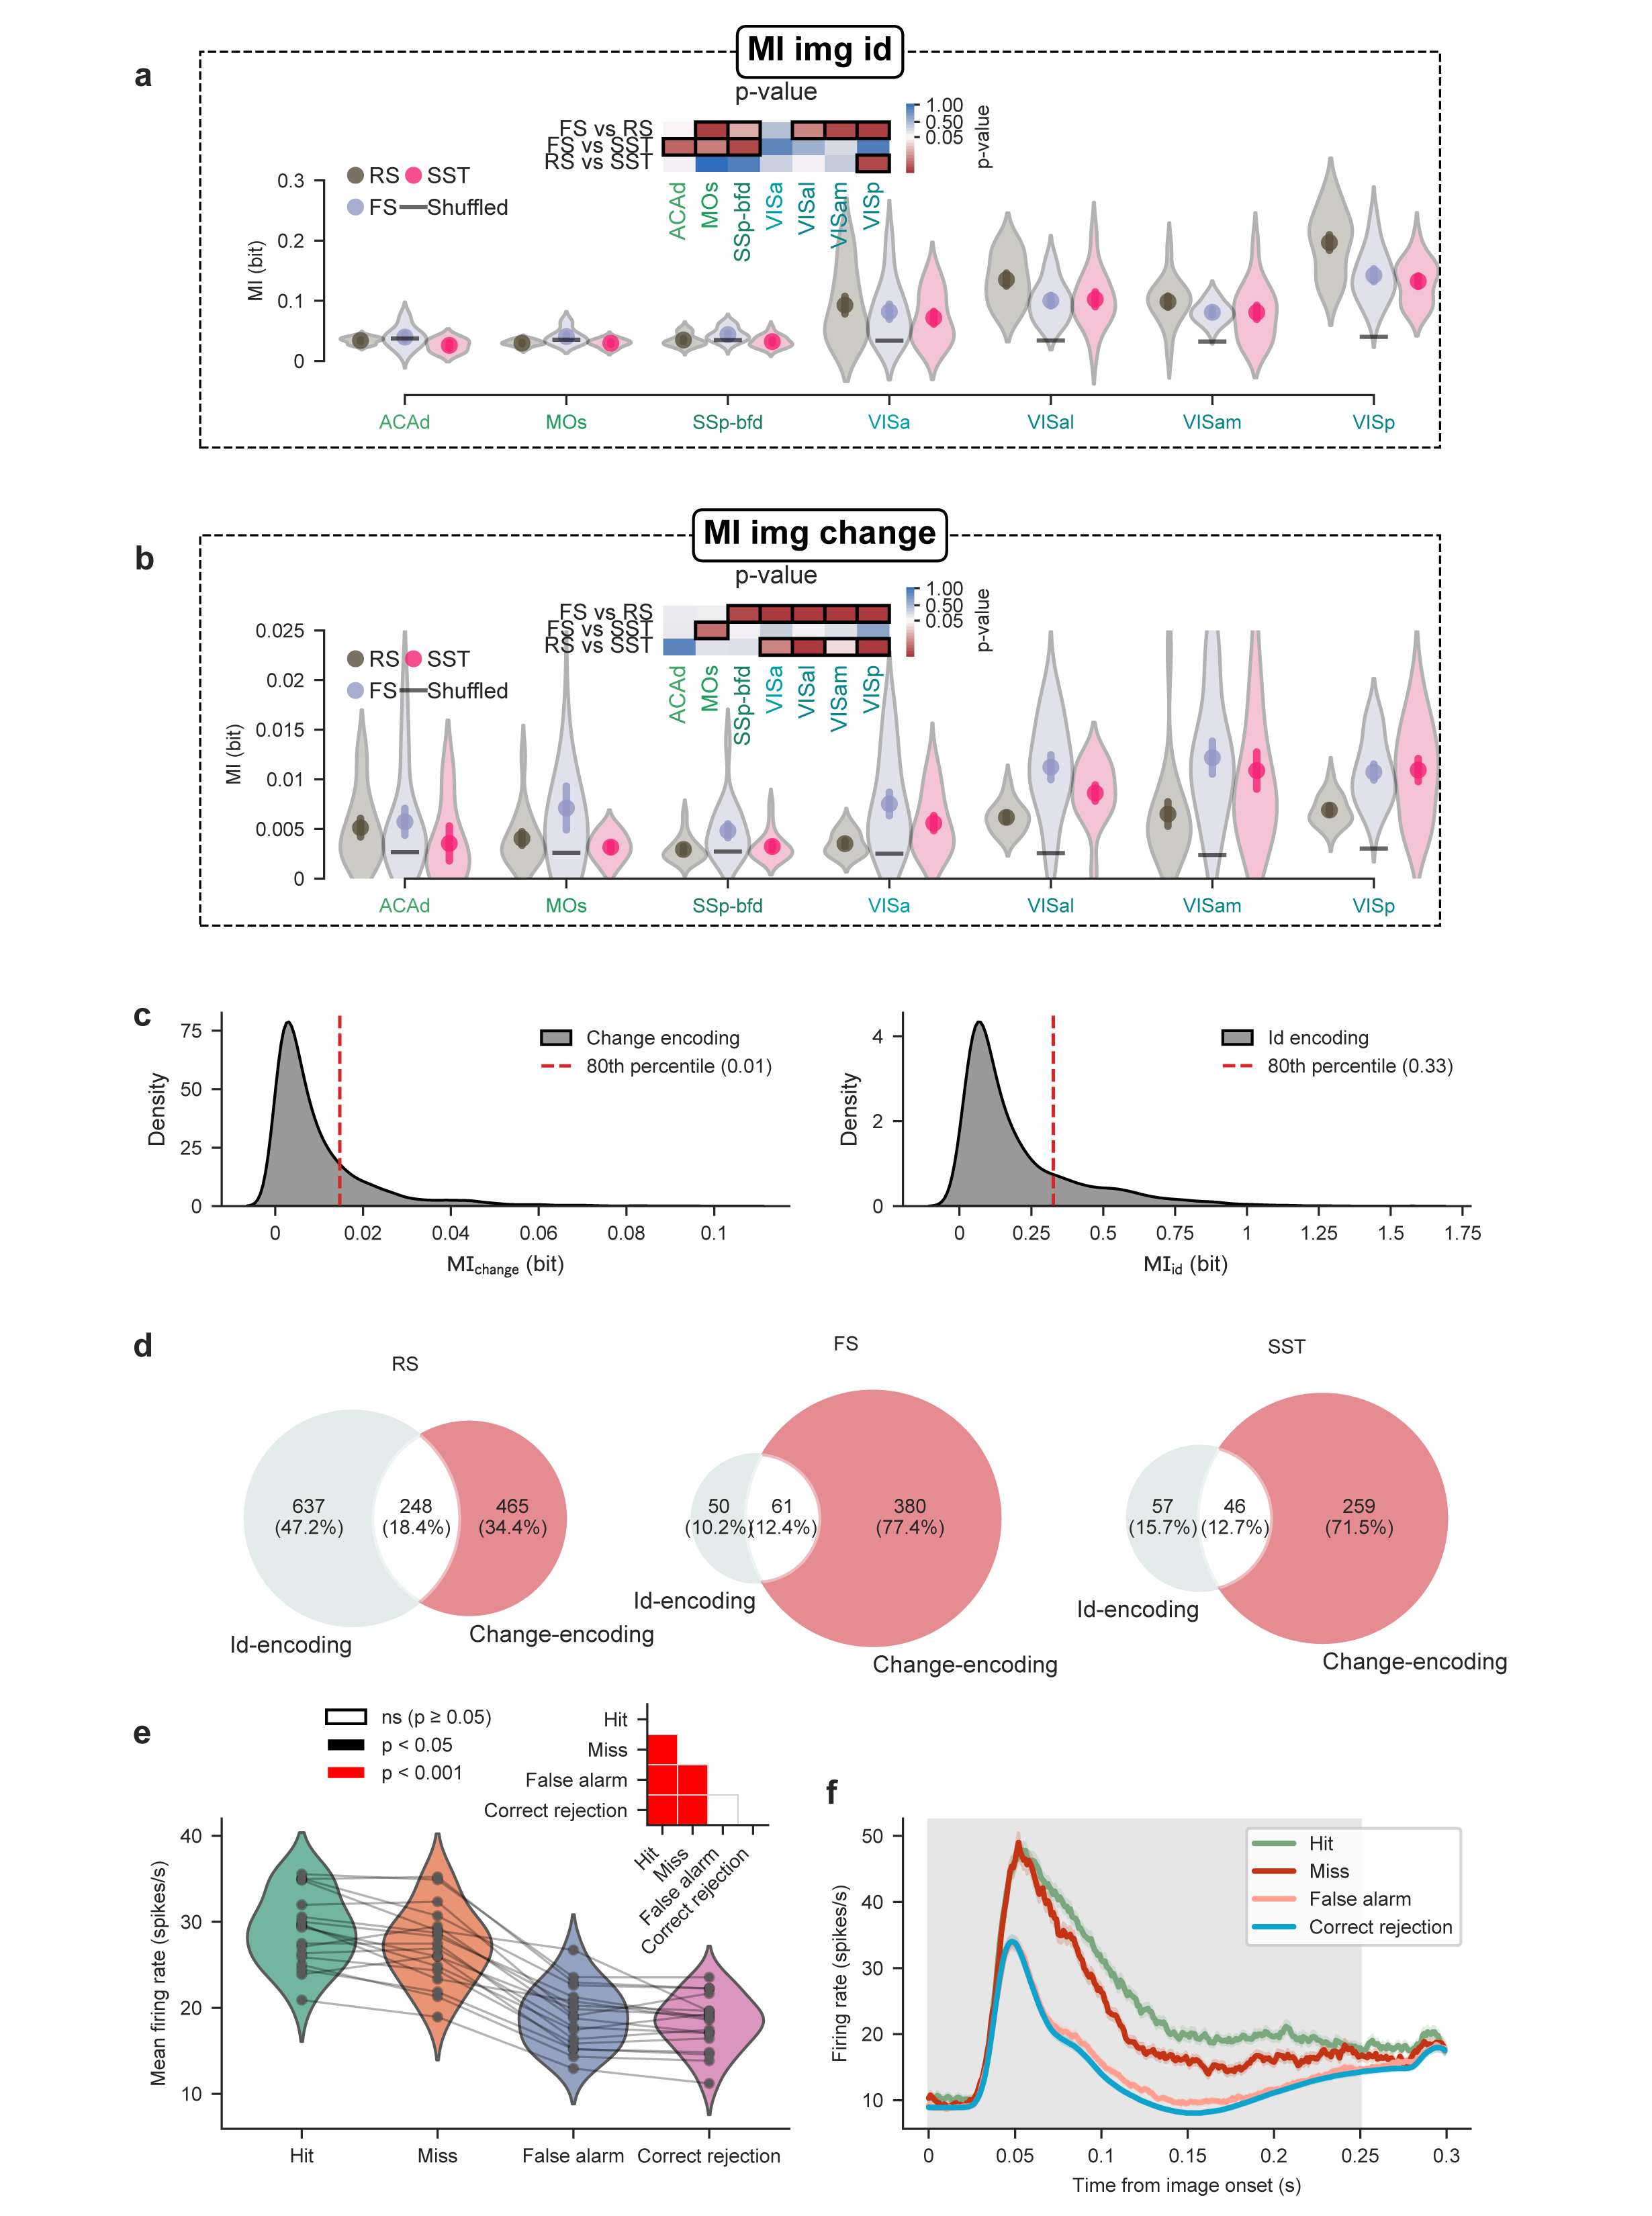
Figure S5:Encoding of image id and change across cortical neurons.
(a) MIid enrichment across visual areas and neuron types. Inset matrix shows p-values for each comparison; red indicates p < 0.05, with darker shades representing stronger significance, while blue-to-white transitions denote values approaching significance (hierarchical bootstrap accounting for session id).
(b) MIchange enrichment in FS and SST neurons is significant across visual areas. Inset matrix shows p-values for each comparison; red indicates p < 0.05, with darker shades representing stronger significance, while blue-to-white transitions denote values approaching significance (hierarchical bootstrap accounting for session id).
(c) Distribution of MIchange (left) and MIid (right) values across neuron types.
(d) Venn diagrams showing the overlap between change- and id-encoding neurons across neuron types.
(e) Mean firing rate of change-encoding neurons across trial types (correct rejection = 10.8 ± 0.3 spikes/s versus false alarm = 11.3 ± 0.3 spikes/s versus hit = 14.6 ± 0.4 spikes/s versus miss = 13.7 ± 0.5 spikes/s; mean ± s.e.m.; p-values determined by pairwise Wilcoxon signed-rank tests with Bonferroni correction). Inset shows the p-value significance matrix.
(f) PSTHs of change-encoding neurons stratified by trial type.
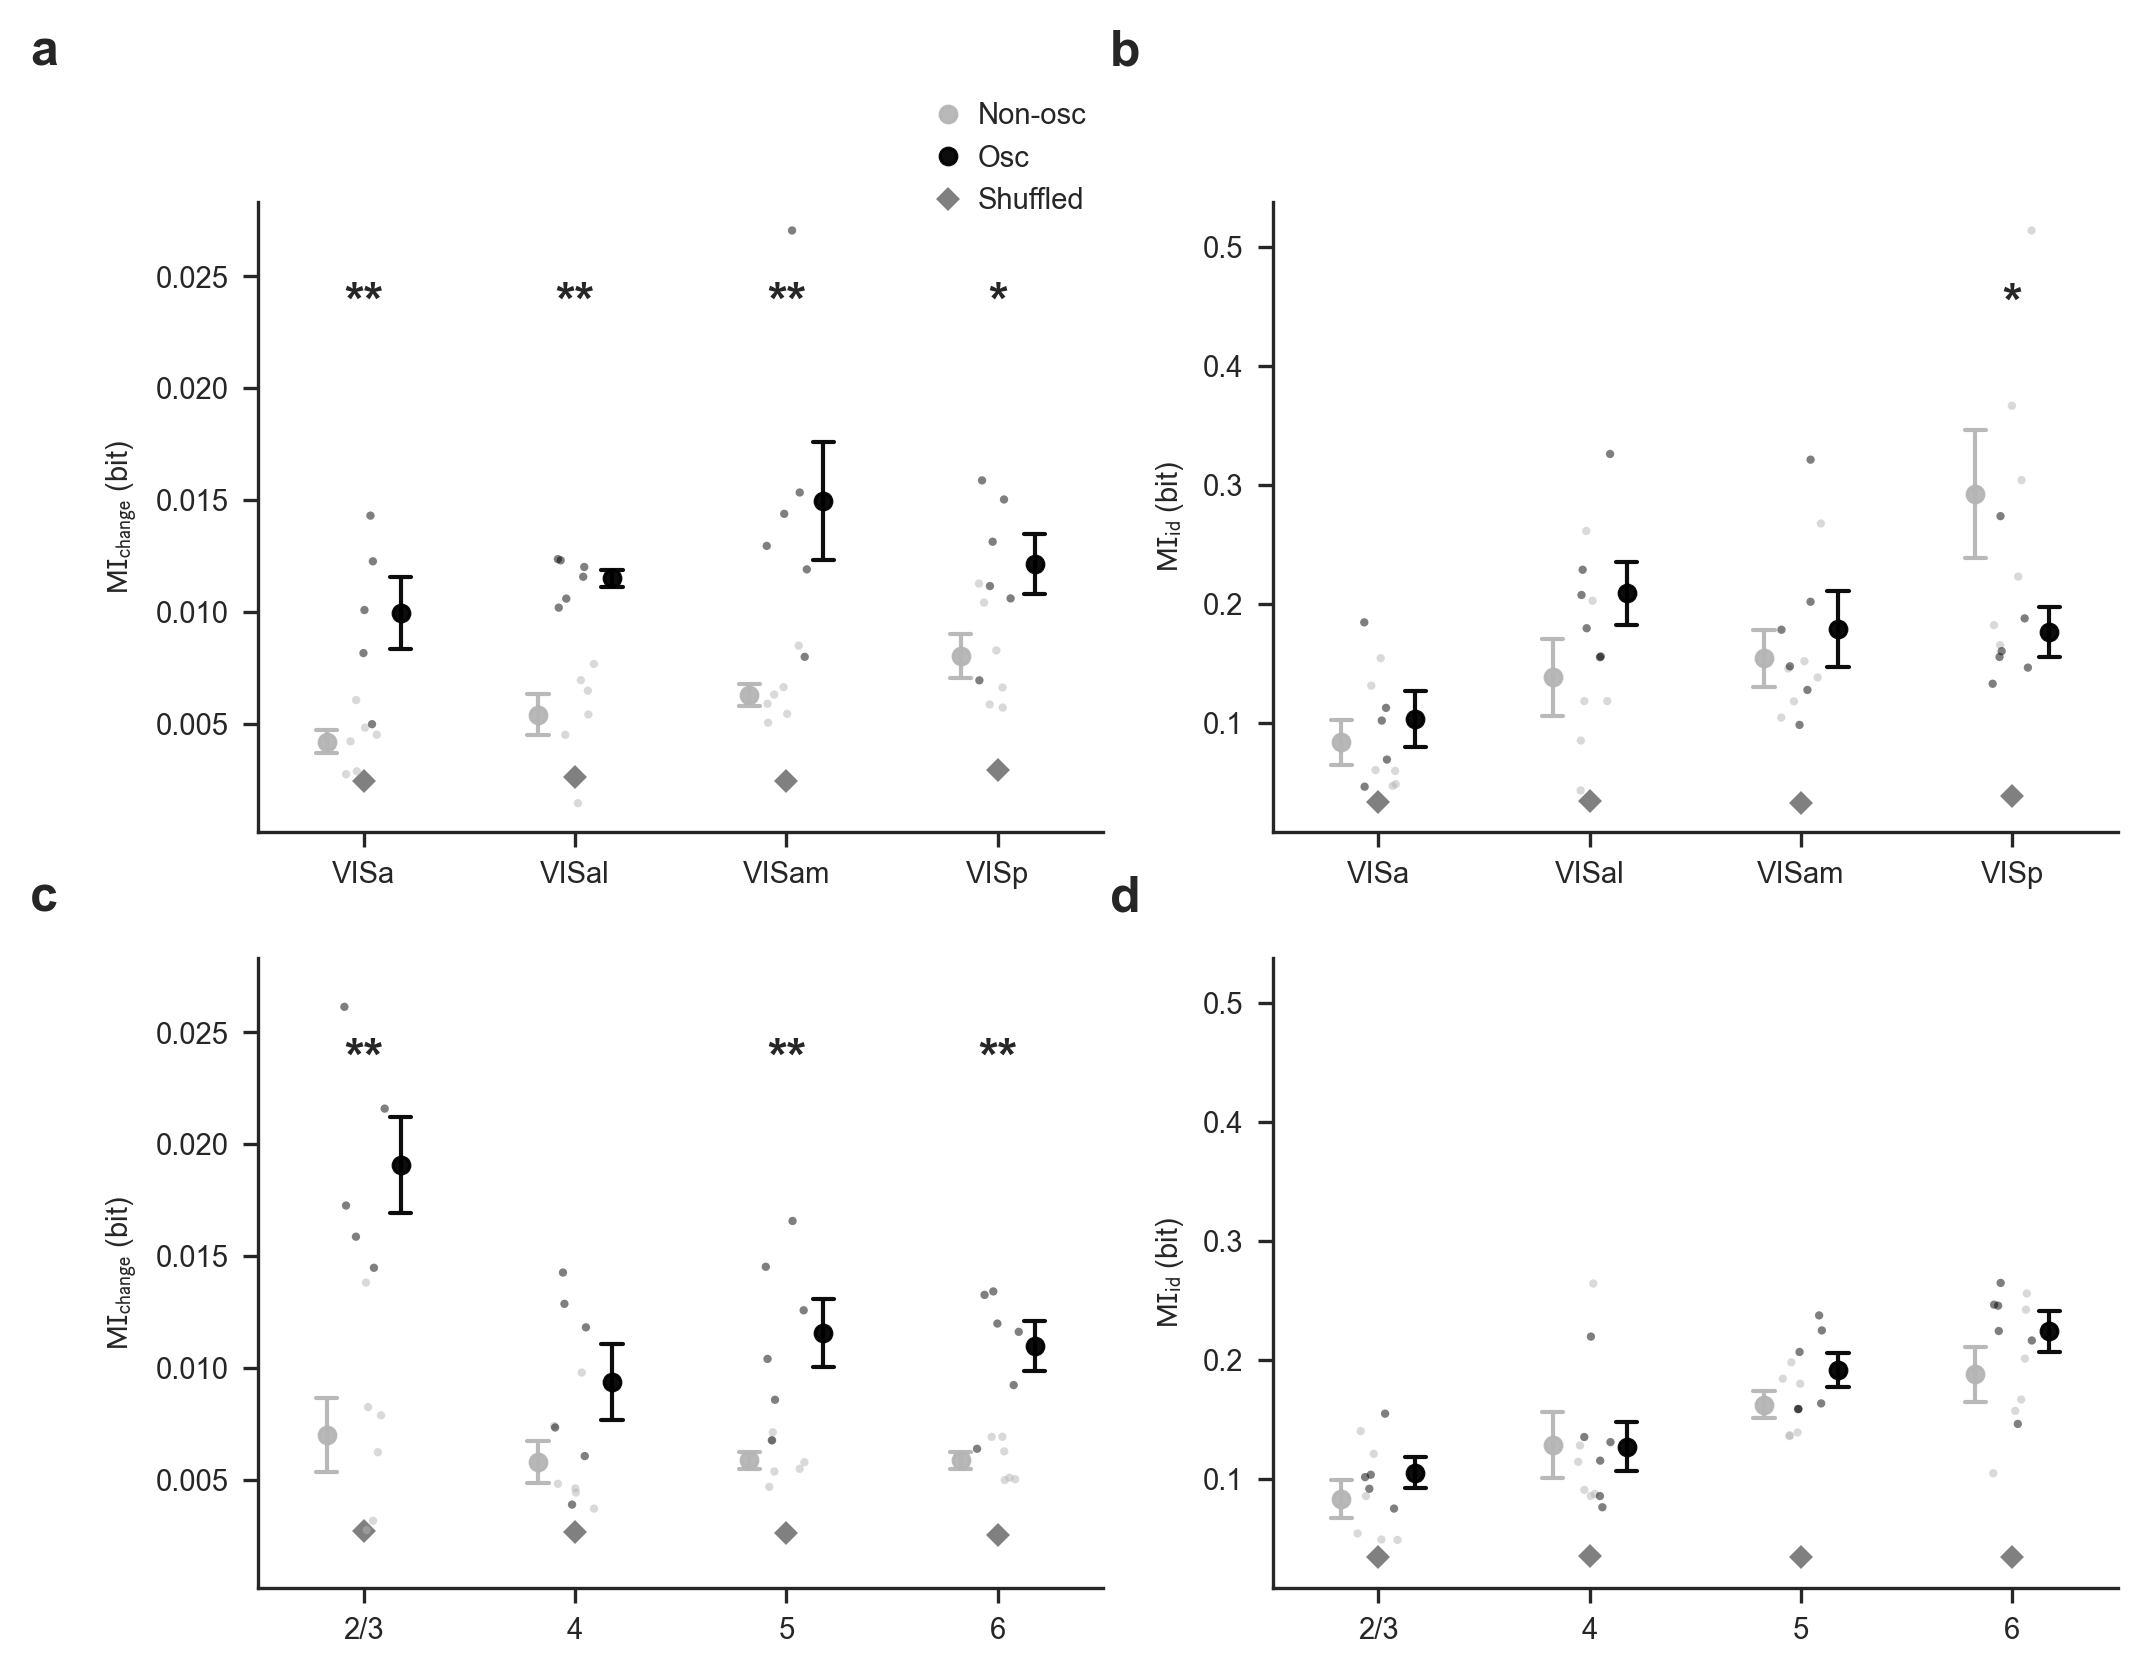
Figure S6:Change information is preferentially enriched in psilocybin-modulated cells across visual areas and cortical layers
(a) MIchange is enriched in psilocybin-modulated cells across brain areas (VISa, p=0.039, VISal, p<0.001, VISam, p<0.001, VISp, p=0.016, hierarchical bootstrap). Psilocybin-modulated neurons are defined as neurons with an Osc index in the top 20% percentile. (b) No widespread differences in MIid by brain area, with the exception of VISp showing significantly reduced MIid in psilocybin-modulated cells (VISa, p=0.93, VISal, p=0.54, VISam, p=0.30, VISp, p=0.017, hierarchical bootstrap).(c) Bottom: MIchange is enriched in psilocybin-modulated neurons across cortical layers, with layer 2/3 being particularly enriched, while layer 4 showing no enrichment (2/3, p<0.001; 4, p=0.14 5, p<0.001; 6, p<0.001, hierarchical bootstrap).(d) Bottom: MIid across cortical layers, with layer 5 showing an enrichment in Osc neurons (2/3, p=0.37 4, p=0.99; 5, p<0.001; 6, p=0.45, hierarchical bootstrap).
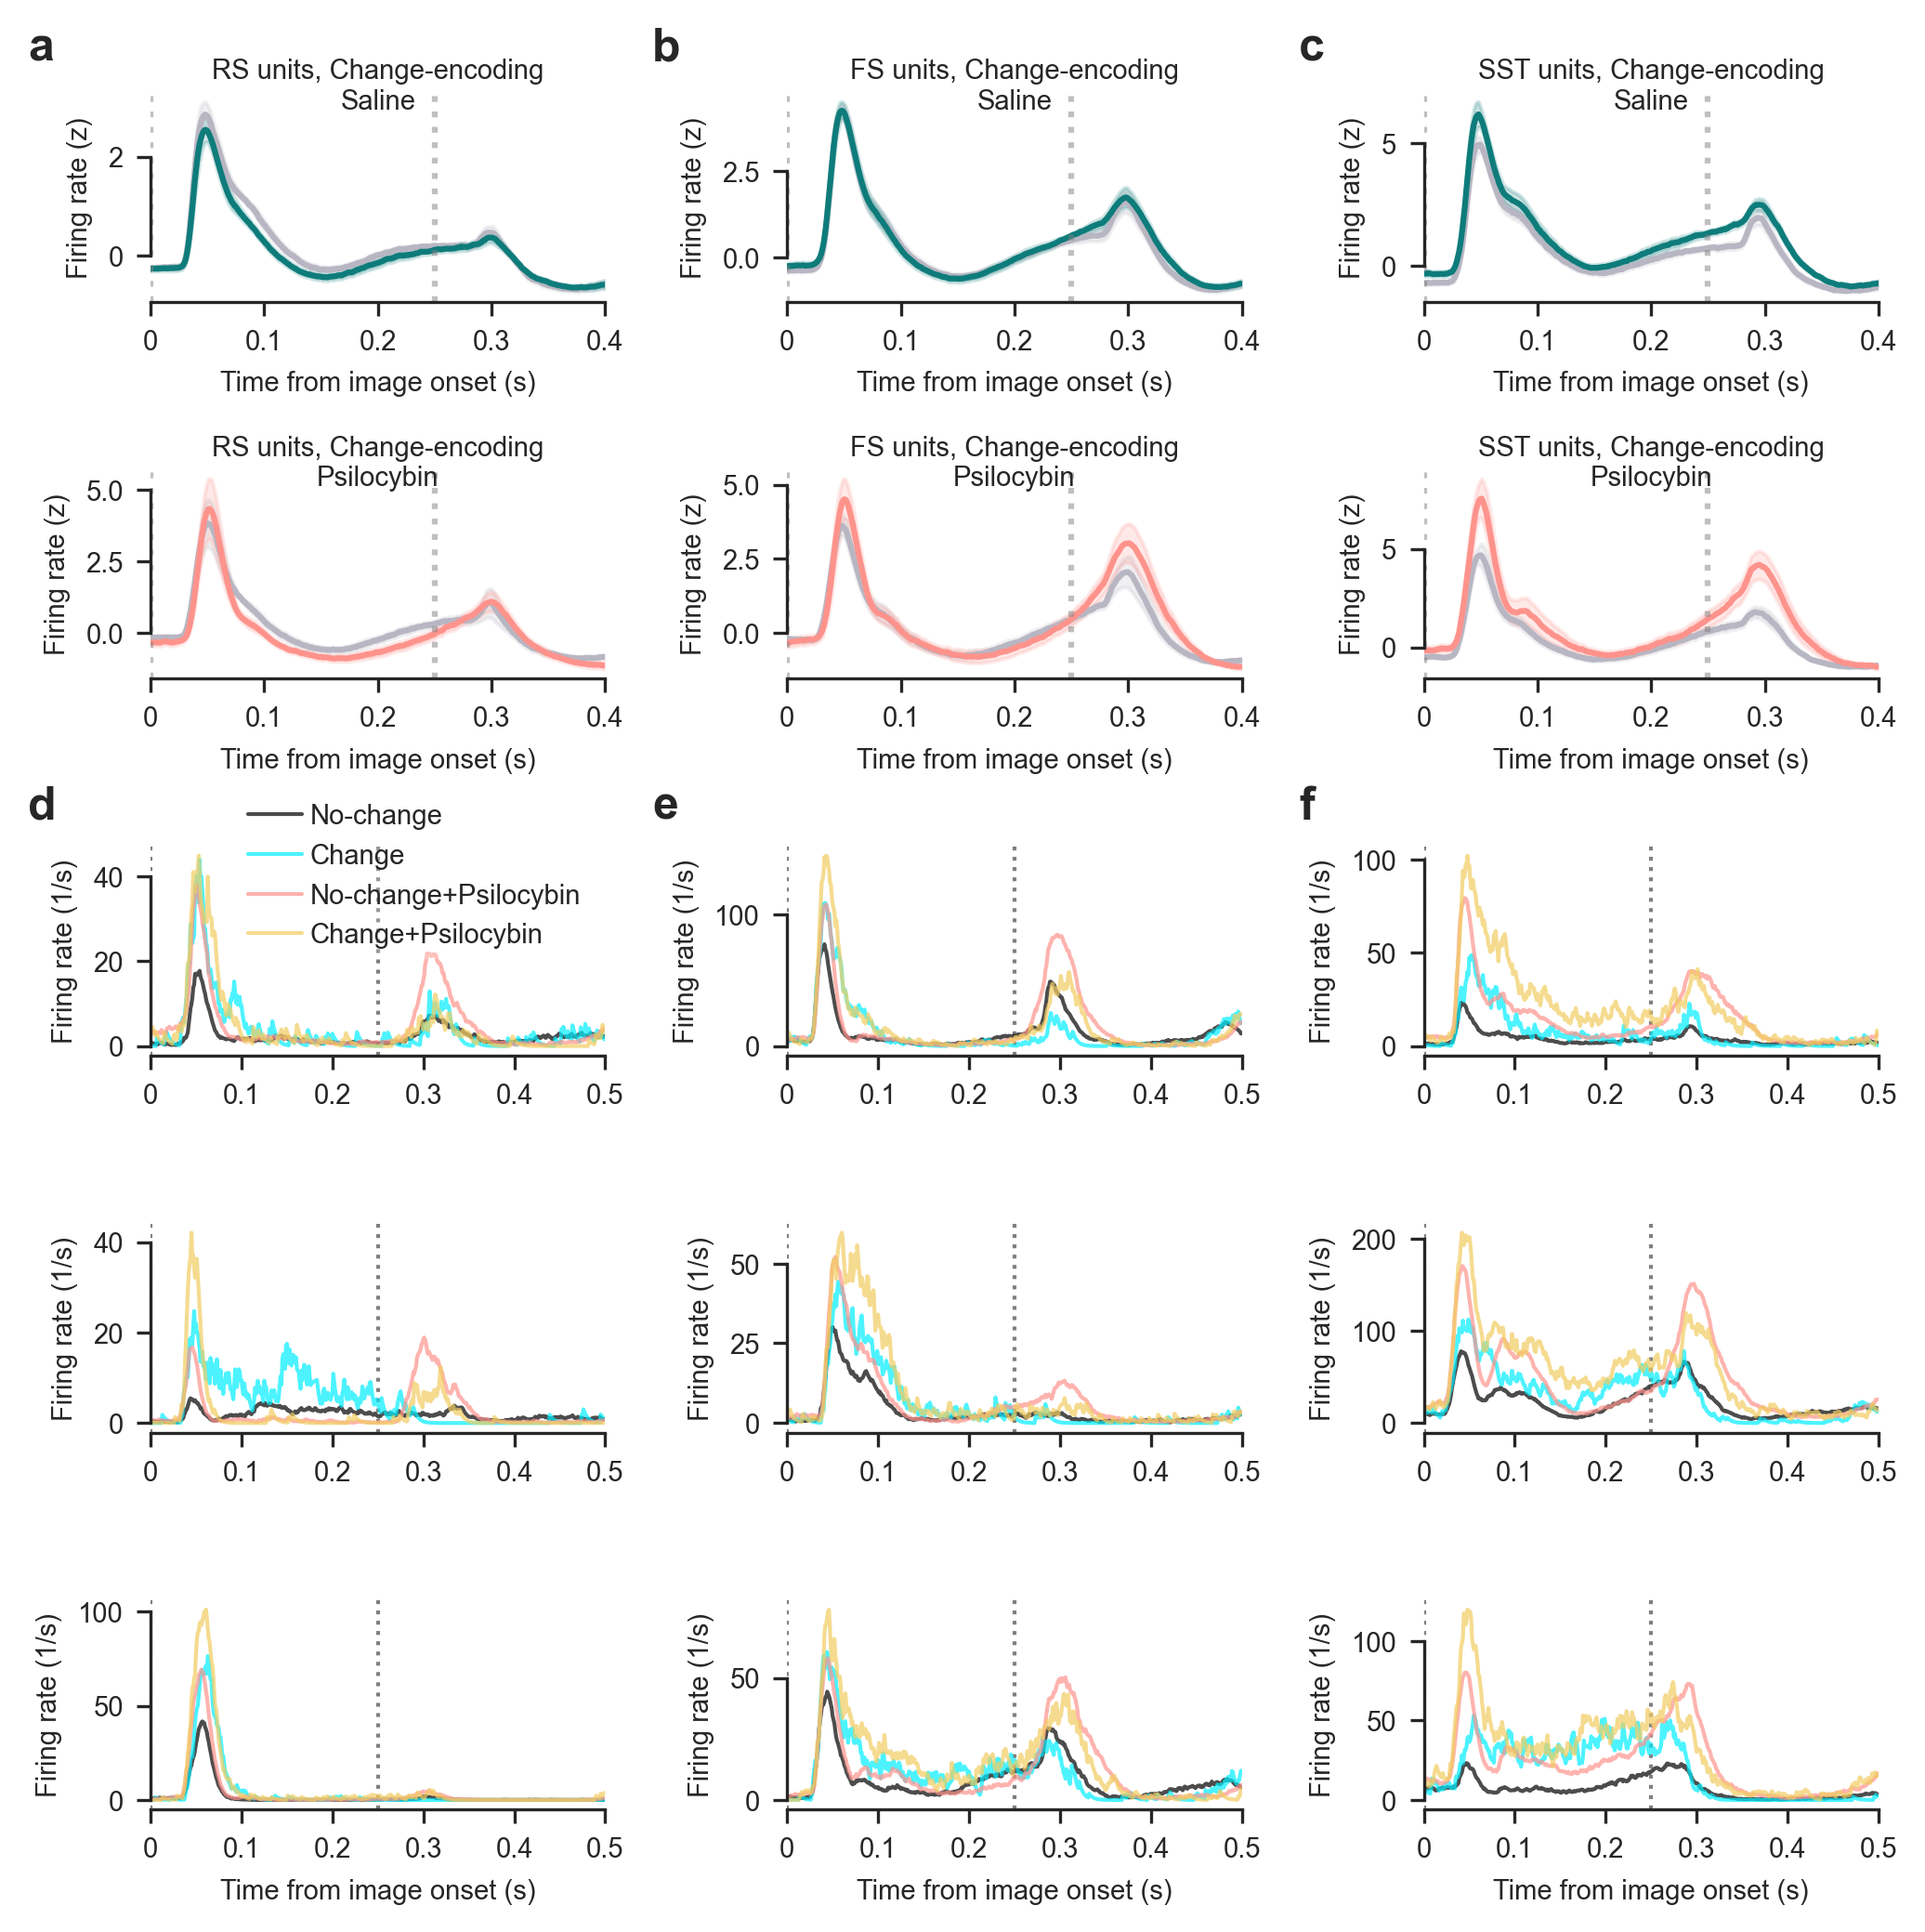
Figure S7:Change-encoding neurons’ responses across experimental conditions
(a) Top: responses of RS change-encoding neurons to no-change images before and after saline injection. Bottom: responses of RS change-encoding neurons to no-change images before and after psilocybin injection.
(b) Same as (a) for FS change-encoding neurons.
(c) Same as (a) for SST change-encoding neurons.
(d) Responses of three single RS neurons to no-change (both before and after psilocybin injection) and change images.
(d) Responses of three single FS neurons to no-change (both before and after psilocybin injection) and change images.
(d) Responses of three single SST neurons to no-change (both before and after psilocybin injection) and change images.
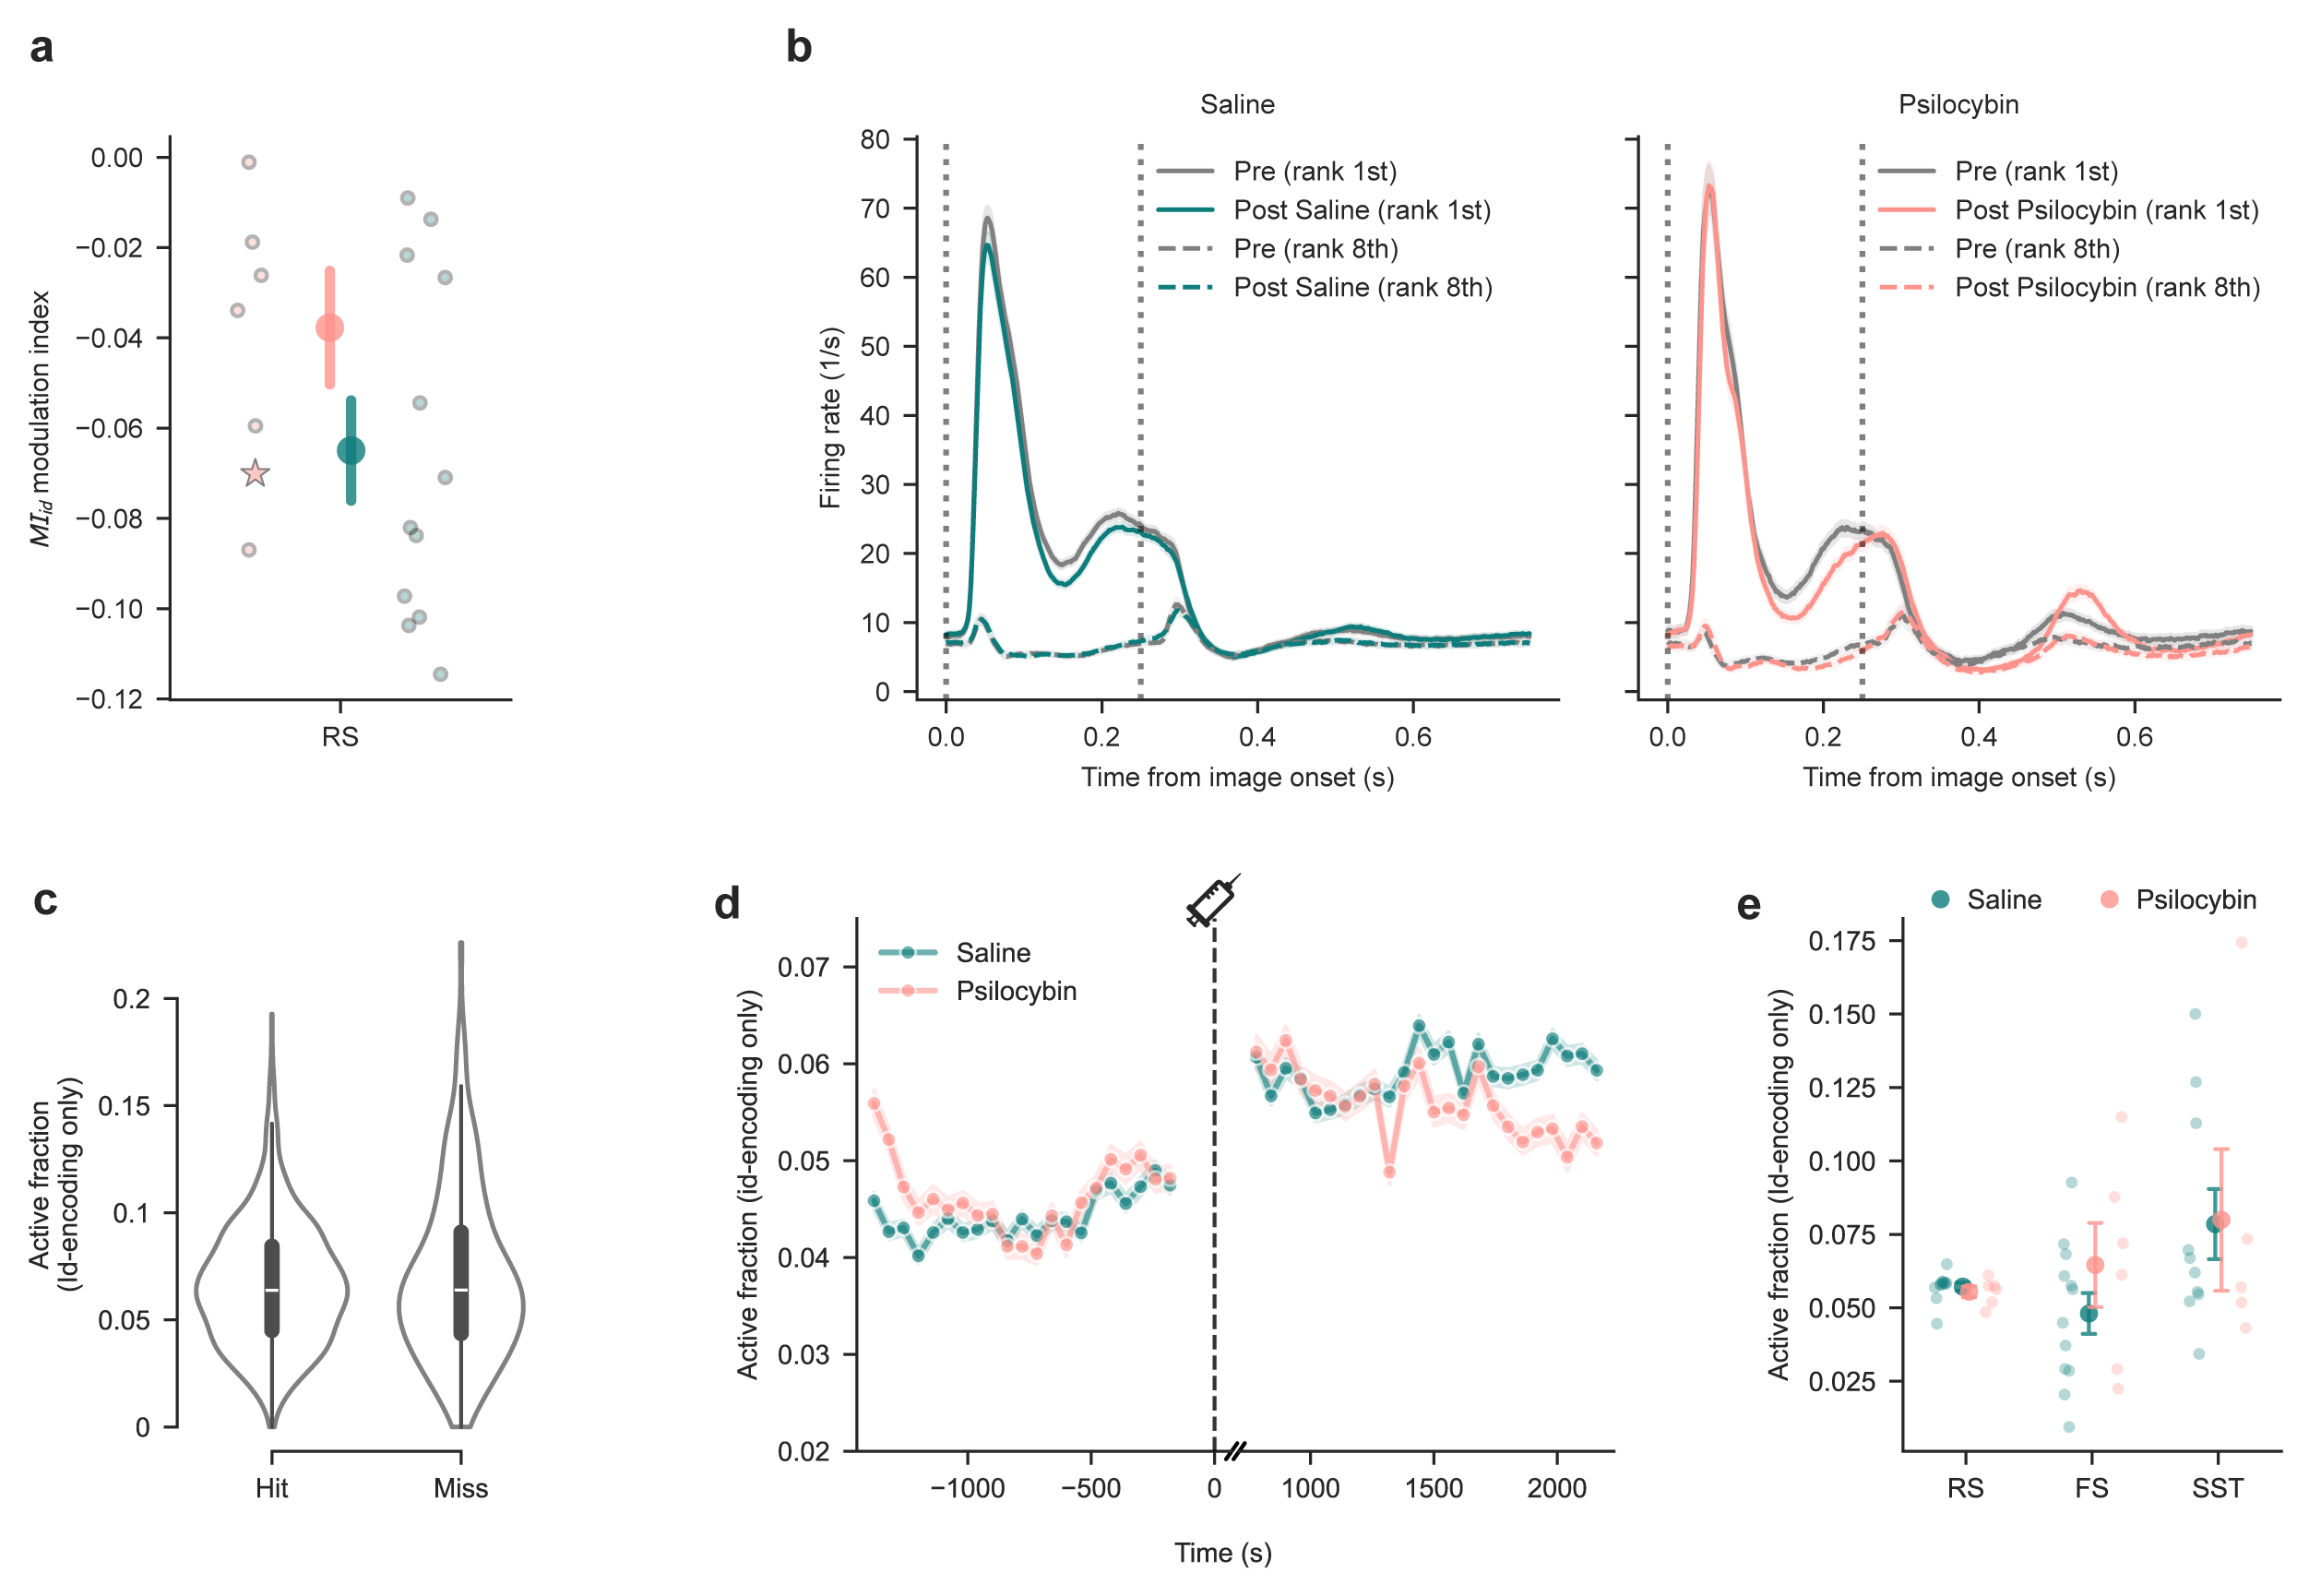
Figure S8:Image id-encoding neurons are not affected by psilocybin.
(a) Average MIid in image id-encoding neurons after injection, showing no significant change between saline and psilocybin conditions.
(b) Population PSTHs of image id-encoding neurons to their preferred (rank 1) and least preferred (rank 8) image before and after injection of saline (left) or psilocybin (right).
(c) Active fraction of image id-encoding neurons during change trials is not different between hit and miss trials.
(d) Active fraction of image id-encoding neurons across before and after saline or psilocybin injection, showing no effect of psilocybin.
(e) Active fraction is not different between groups in all three neuron types.
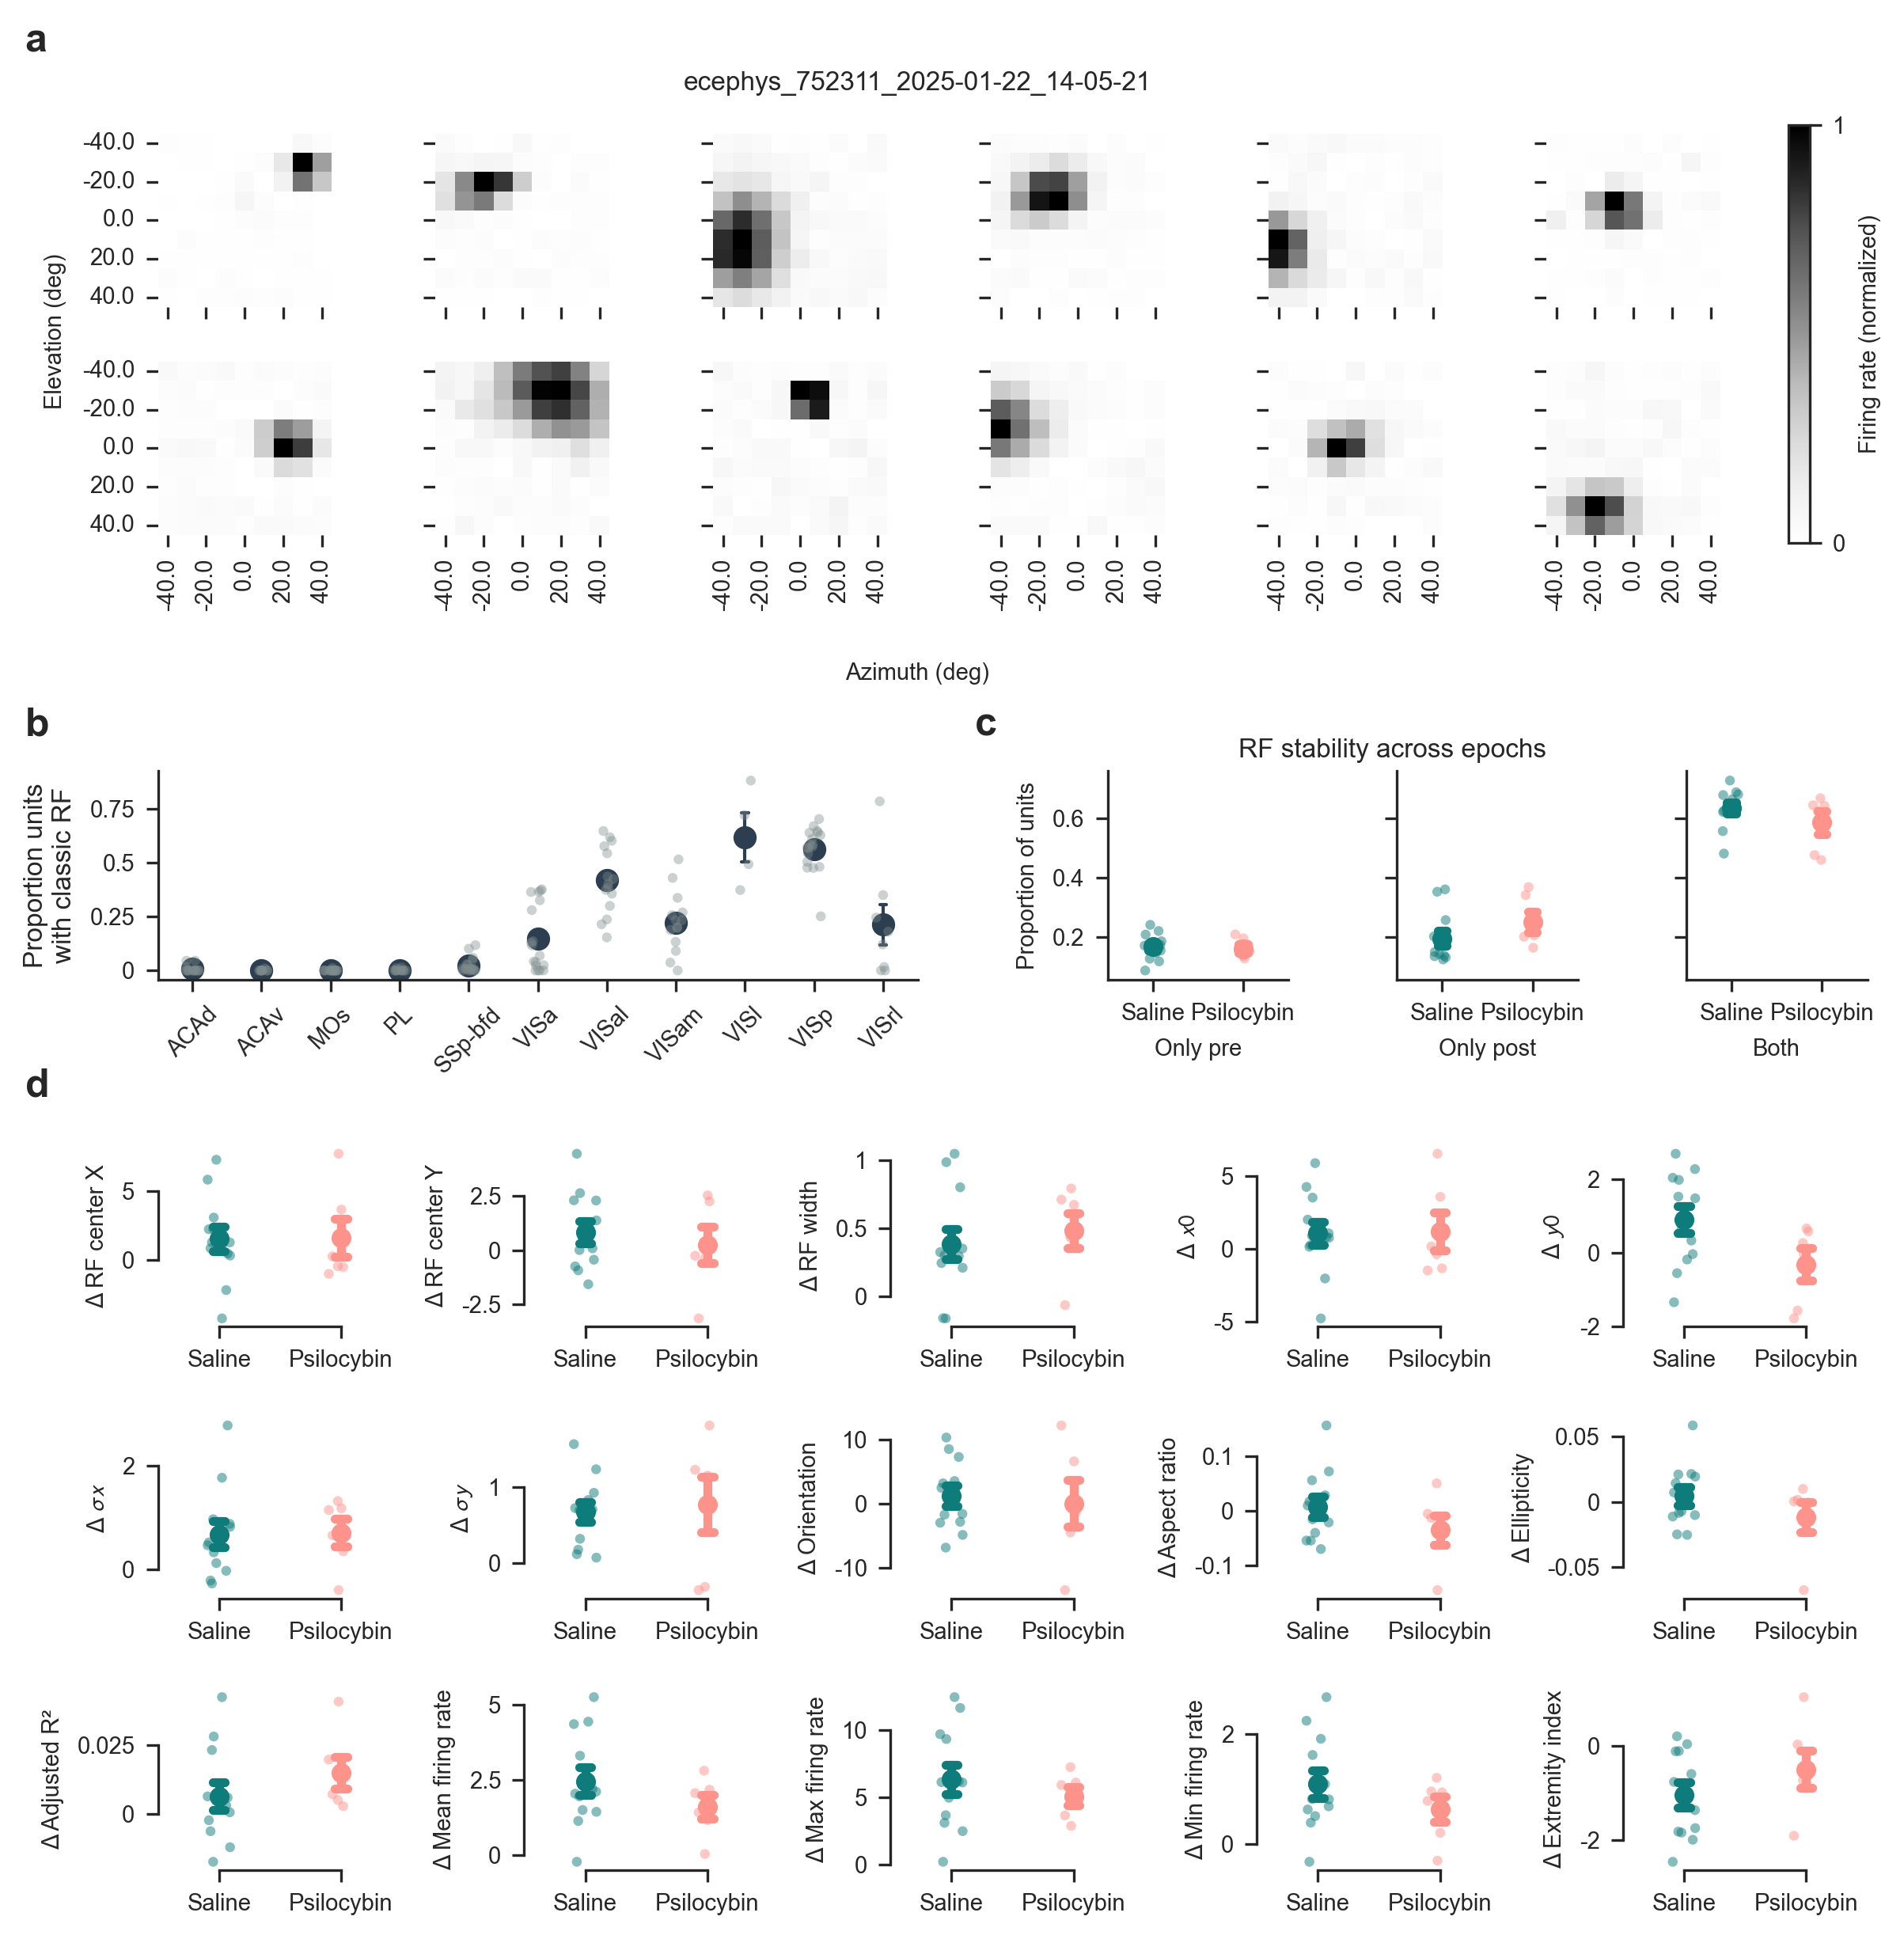
Figure S9:Receptive field tuning is not affected by psilocybin
(a) Representative examples of neurons with classic receptive field (RF) tuning.
(b) Proportion of neurons exhibiting classical RF responses per brain area.
(c) Proportion of neurons showing RF tuning only before injection (pre), only after injection (post) or in both epochs. Psilocybin does not affect the RF stability.
(d) Psilocybin‑evoked changes in RF parameters, compared to saline. Each panel shows the per-session mean change (δ = post - pre) for a given spatial, geometric, or baseline response metric. Extracted features encompass empirical properties (RF center x (medio-lateral), RF center y (dorso-ventral), and RF width), parametric variables optimized via rotated 2d Gaussian surface fits (x₀, y₀, σ x, σ y, orientation, aspect ratio, ellipticity, and adjusted R²), and global non-parametric matrix dynamics (extremity index, mean firing rate, min firing rate, and max firing rate). Each individual dot represents a single session average, and the point plots display the group mean ± s.e.m. No significant differences in parameter dynamics were observed between the psilocybin and saline experimental cohorts (hierarchical bootstrap, all uncorrected p > 0.05).
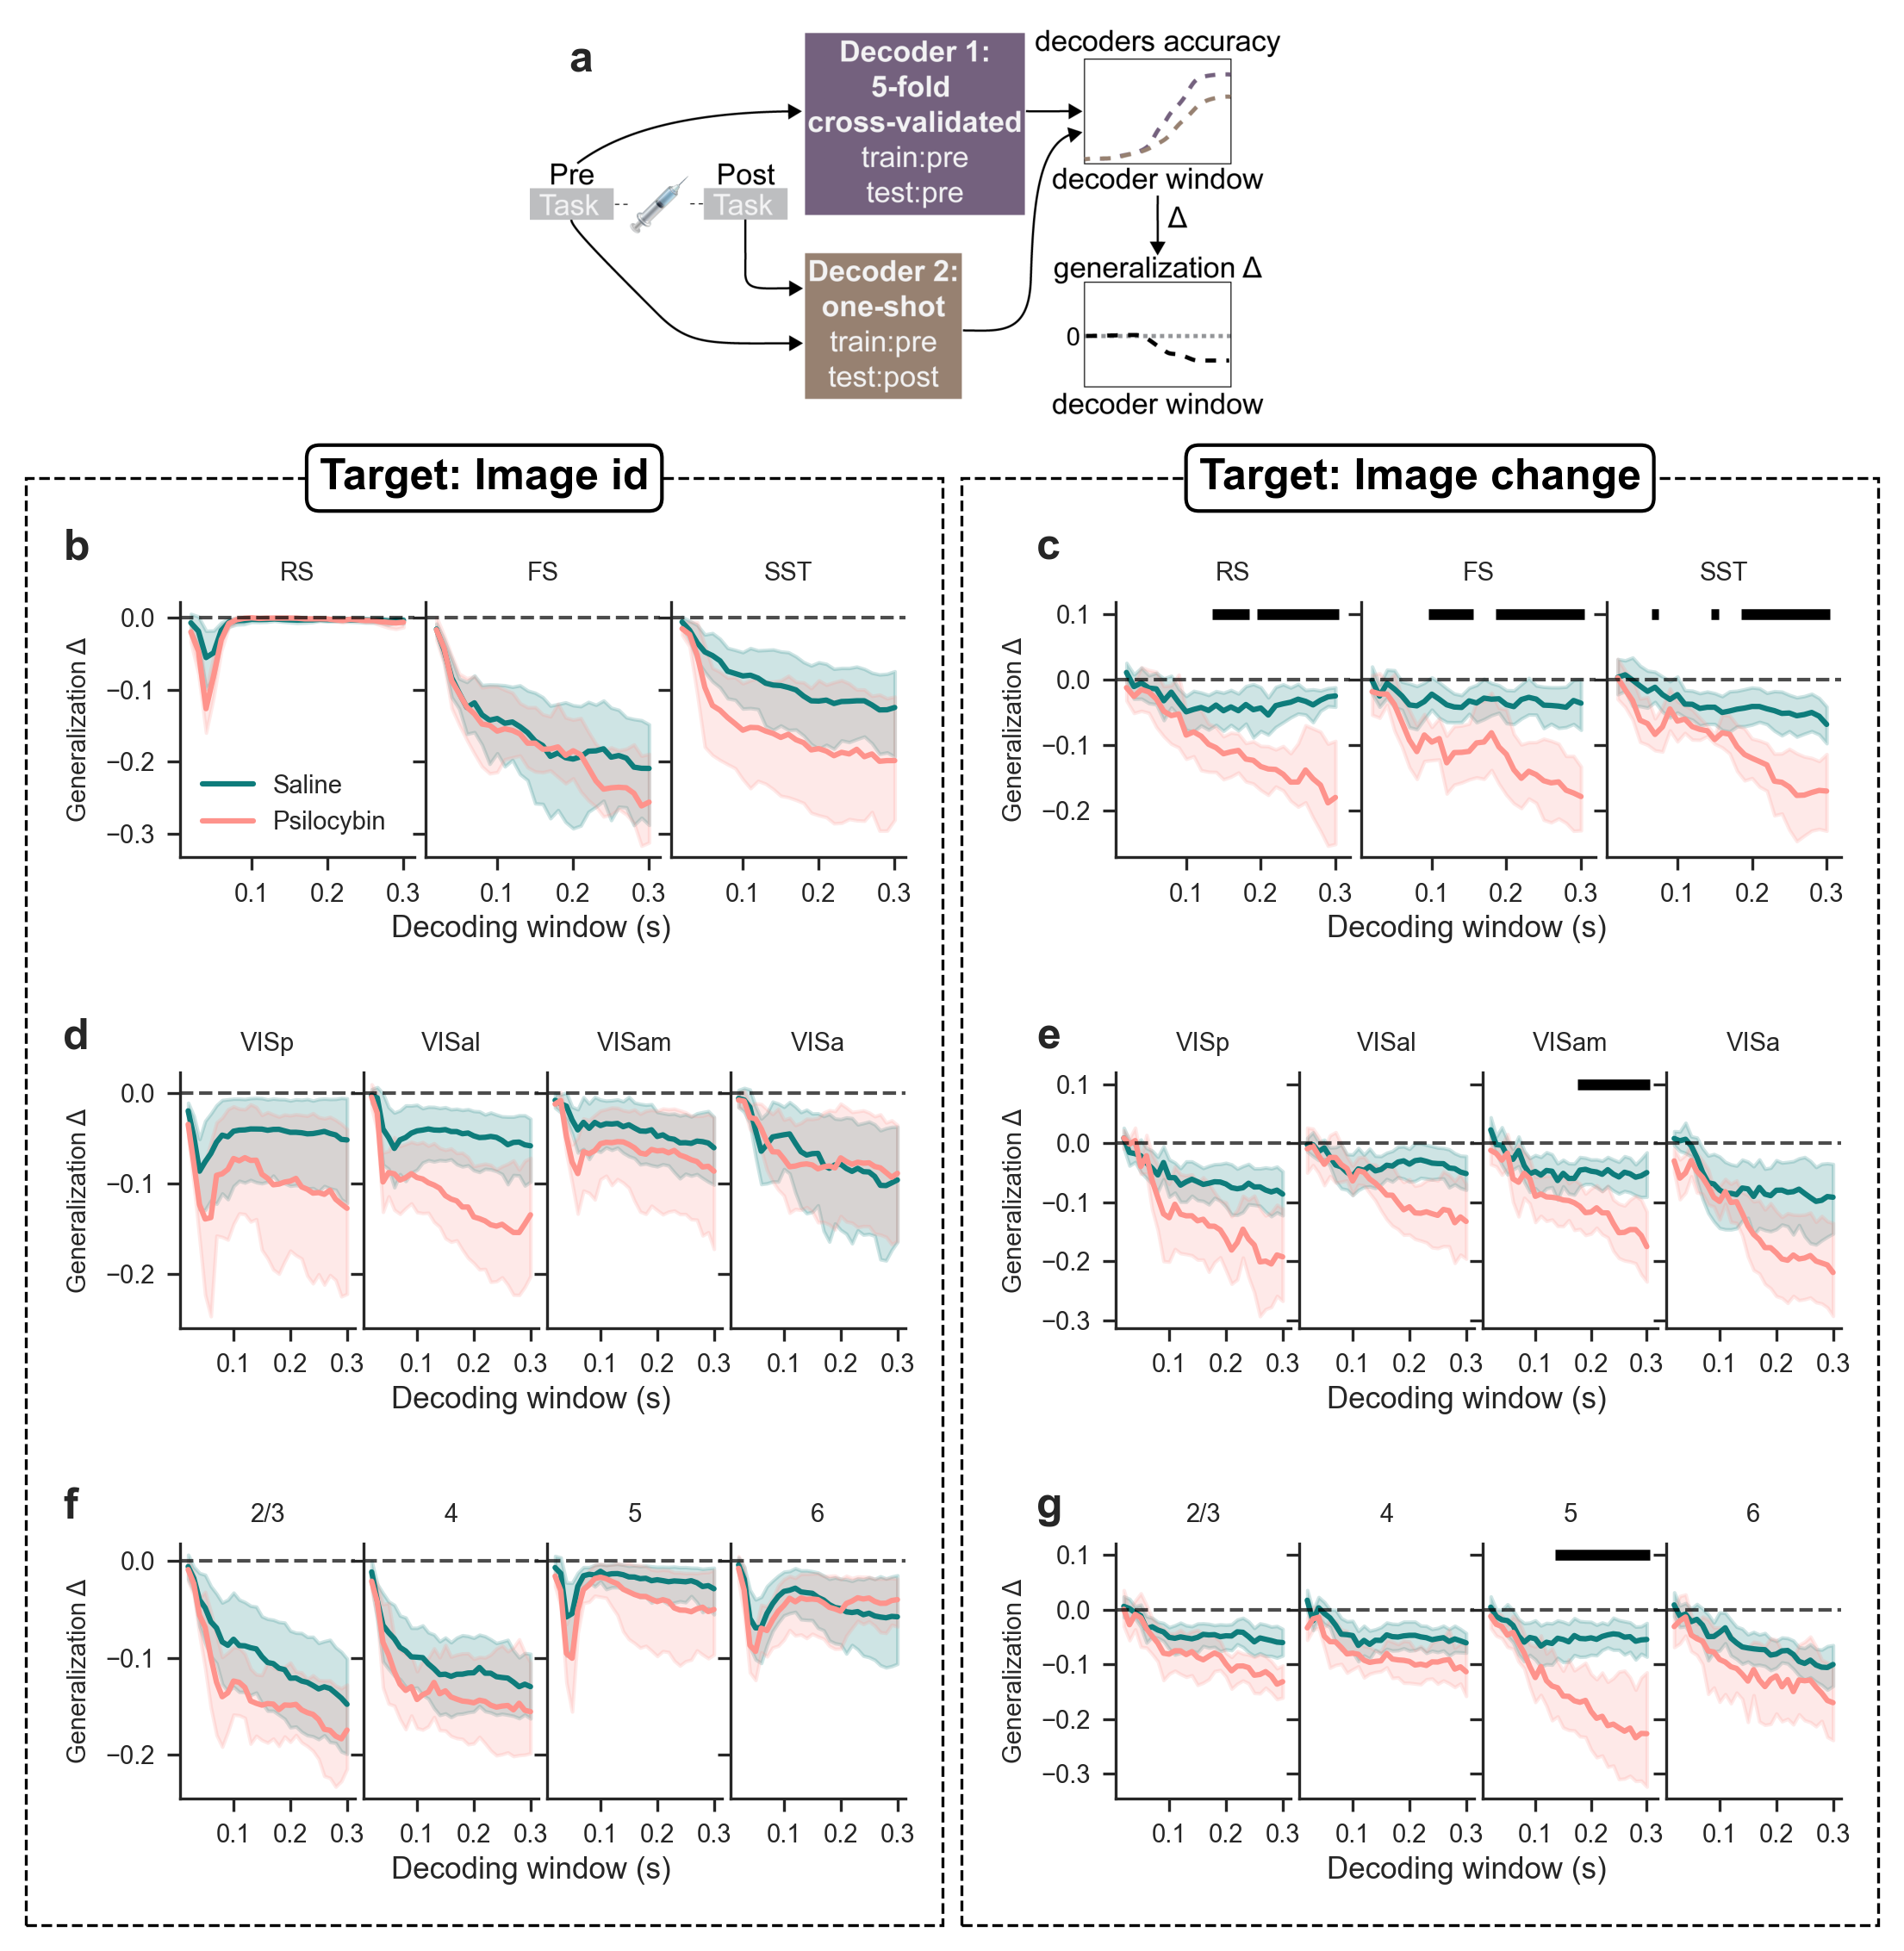
Figure S10:Decoding image identity and change across neuron types, brain areas and cortical layers.
(a) Decoding procedure schematic. Two decoders are trained on activity during pre-injection epoch. The first one is tested using cross-validation on the same pre epoch, the second one is tested on the post epoch.
(b) Decoding accuracy for image id over increasingly large time windows across neuron types. Black horizontal bars indicate significant differences between injection conditions (p < 0.05, FDR-corrected independent two-sample t-tests).
(c) Decoding accuracy for image change over increasingly large time windows across neuron types.
(d) Decoding accuracy for image id over increasingly large time windows across brain areas.
(e) Decoding accuracy for image change over increasingly large time windows across brain areas.
(f) Decoding accuracy for image id over increasingly large time windows across cortical layers.
(g) Decoding accuracy for image change over increasingly large time windows across cortical layers.
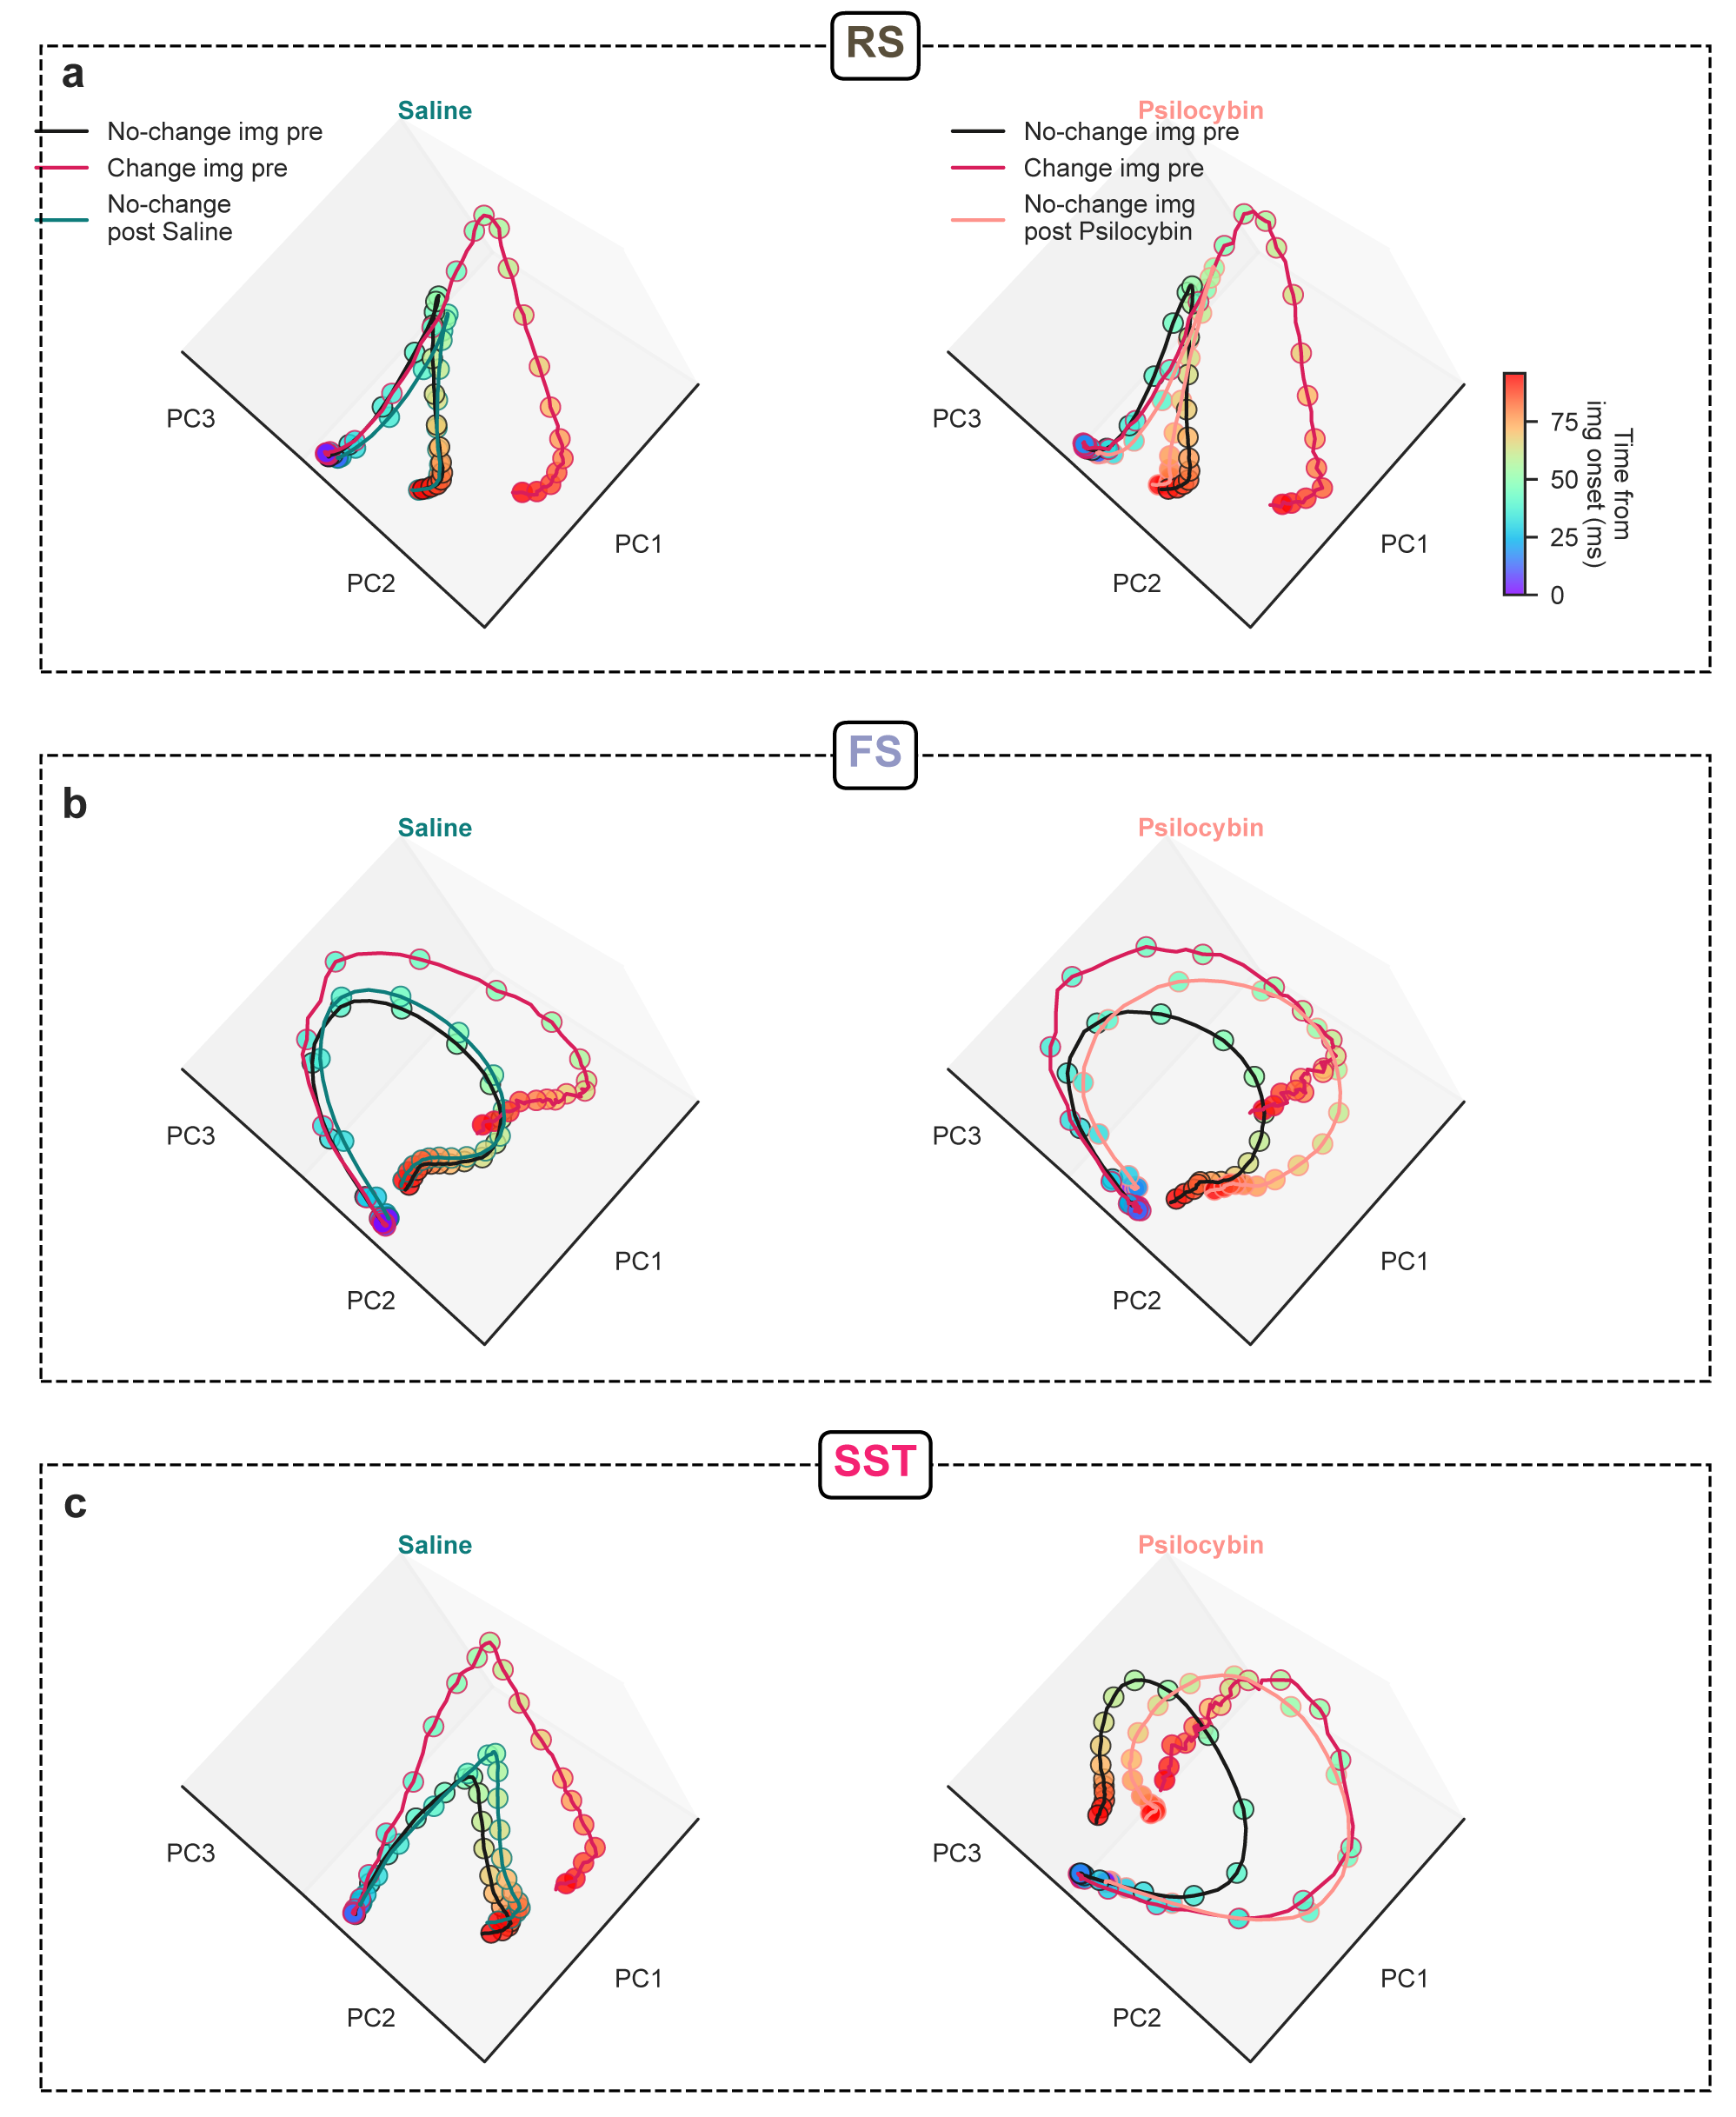
Figure S11:Psilocybin shifts sensory representation of non-change images in SST neurons
(a) RS-neuron population trajectory in the space defined by the first three principal components (PCs), showing RS activity during no-change images (black line), change images (orange line) and no-change images after injection (saline in teal on the left column, psilocybin in salmon on right column). Superimposed dots represent time progress from image onset 0-100 ms (white to black).
(b) Same as (a) for FS neurons.
(c) Same as (a) for SST neurons.